
HD Long-term outlook
Home Depot is the blue-chip stock which defies all odds as the company share prices hit an all-time high. Despite all retail companies doom & gloom, the company book healthy profit. This is due to re-emergence of the first-hand buyer and the boom in the housing market also appreciation in home prices.
The outlook for housing and prices will continue strong in the future and investors will expect HD share prices continue upward.

Click here to see HD March analysis
New Month
Monthly chart

HD venturing upside as expected and continue to stick inside the bullish channel established. There is no change to current outlook, and the share prices hit the top of the channel. Though there is a reason to short HD, traders might consider the possibility share prices are moving up while sticking at the top of the channel.
Weekly chart
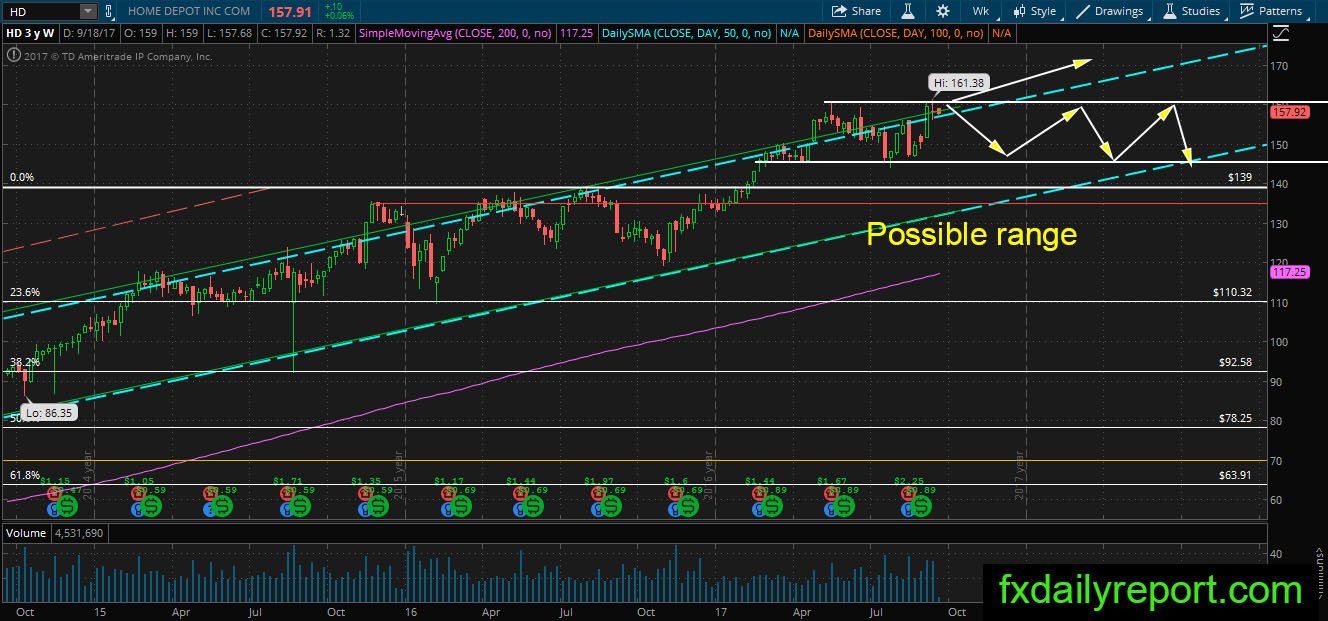
HD path is upside, and the share prices hit a new record high in the previous week. However, looking at the weekly chart, there is possible range between $145 – $161. If the share prices formed a bearish pattern near the resistance level, HD might start correction toward the bottom of range $145.
Daily chart

The daily chart of HD show possible triangle with a cap around $161.00. The price is currently hovering down after touched the resistance and looking for a floor to trade higher. If the price continues lower below the top of the blue channel, it will try to reach the white trendline below it.
Trade plan
The bullish position could be taken from the top of the blue channel on the daily chart. Alternatively, if the price moves lower, traders could also look for a long position at the white trendline.
The bearish position could be taken from the $161.00 resistance level.