
KMB Long-term outlook

Kimberley Clark share prices succumbed to bearish pressure and closed below August low. Initially, August show hope for a bullish reversal, but with the lower close on September, the hope was dismissed. Overall, KMB lost 4.7% in September fell from $123.5 to $117.68. The slide continues in October, currently traded at $115.55.

The company expected to report earnings on 23 October 2017, will the profit margin improved?
Despite the cost-cutting done by the company, inflation in inputs cost and decline in sales dented company profitability. KMB might not see much change in the company situation which is negatively impacted by higher competition and rising inputs costs.
Click here to see KMB August 2017 analysis
New Month
Monthly chart
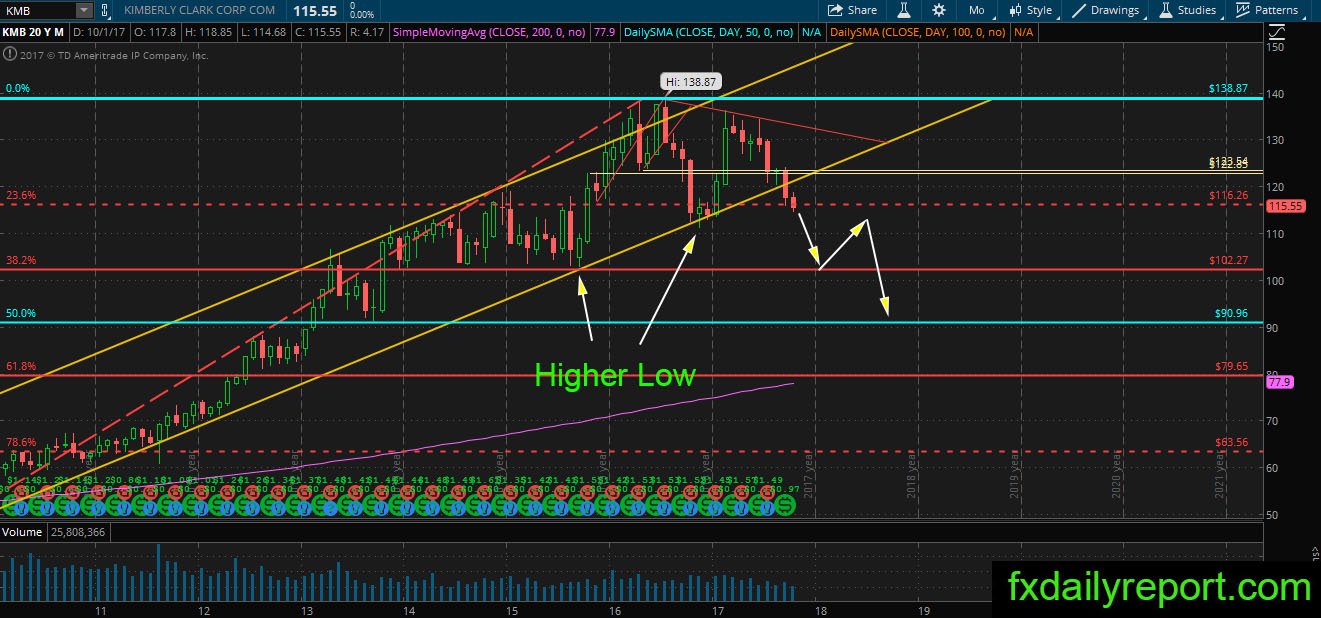
KMB finally close the page of its bullish trend with a first time close below the bullish channel on the monthly chart. The price continues lower in October and showing no sign of reversal yet. Fortunately, there is no lower low printed on the chart yet. If KMB could reverse the bearish trend and close back above the bullish channel, it will cancel the breakout.
Weekly chart
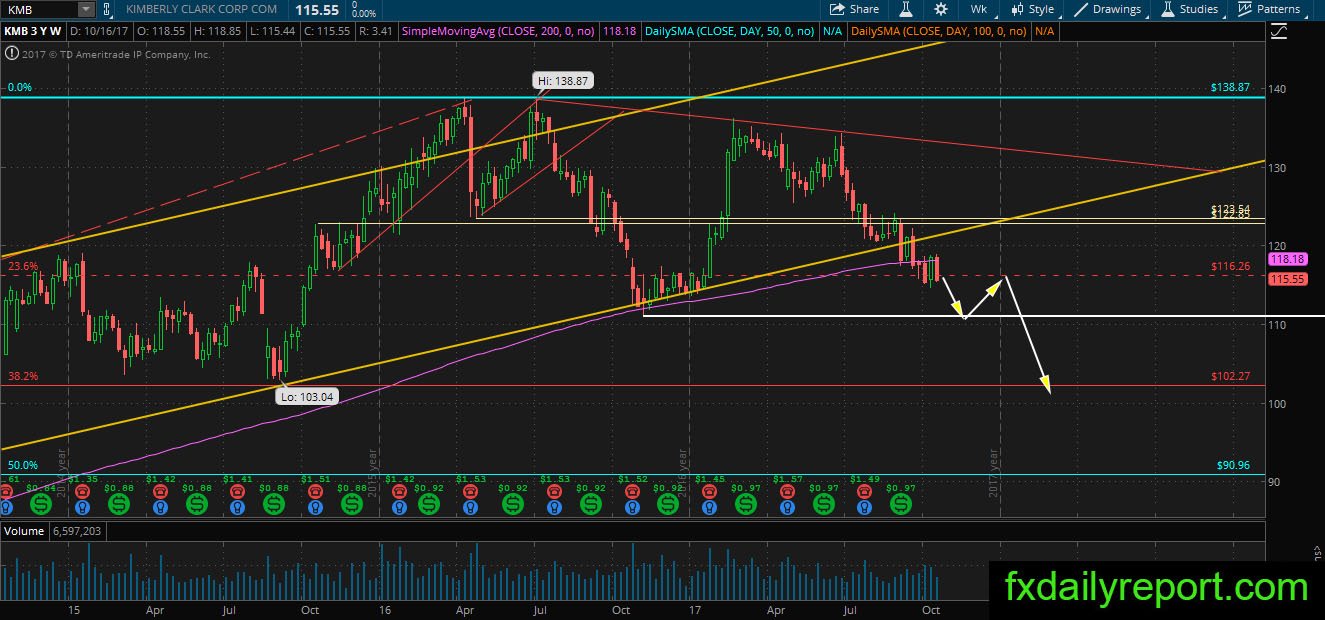
Dark and cloudy outlook also seen on KMB weekly chart. The share prices are losing grip of its weekly SMA 200 and slip in the latest week. The selling pressure looks will continue and reach the previous swing low around $111.00 – $112.00. The close below this range will trigger more aggressive selling on the share.
Daily chart

The bear is in full control since the share prices slip below the daily SMA 200. All recovery attempt hit the roadblock at daily SMA 50, and the price gradually moves lower. The share prices should continue to move lower, and traders could look for short position near daily SMA 50.
Trade plan
Long position needs to wait, the trend of KMB switch to bearish, and it slips below the long-term bullish channel.
The short position could be taken near daily SMA 50.