
MCD Long-term outlook
MCD share prices take a break on December’17 trading as the share prices move between $170.39 – $175.78. Overall, for the year 2017 MCD gained 41.4% from $121.72 to $172.12 without any significant pullback.
On the operation, the company said it would eliminate foam packaging by the end of 2018 and adopt 100% fiber-based packaging by 2020. The move likely was made by MCD to approach customers who concerned on the company’s social responsibility.

The innovation in delivery services is one of the major reason MCD could stay competitive in the product prices. The joint venture with Uber Eat shows how serious MCD is venturing into the delivery services. This year key would be how MCD react to food inflation and serve value meal which could compete with grocery prices.
Insider trading

No change in the insider trading since latest sale by Easterbrook Stephen. MCD share prices on track higher, but has limited upside. $168.32 might become the magnet for MCD share prices.
Read McDonald November 2017 analysis
New Month
Monthly chart

Similar to previous analysis, there is no reason to place short position yet and no reason to long at the current level. Traders suggested waiting until the share prices retrace 10-30% before jumping in a long position. Level around $130.00 is the ideal level to watch.
Weekly chart

The best setup to watch on MCD weekly chart is a pullback to $160.00 breakout level followed by the strong bullish pattern. Another level to consider for long is the top of the white channel. A short position is not suggested as the trend is bullish and U.S stock market moving in the strong bullish move.
Daily chart
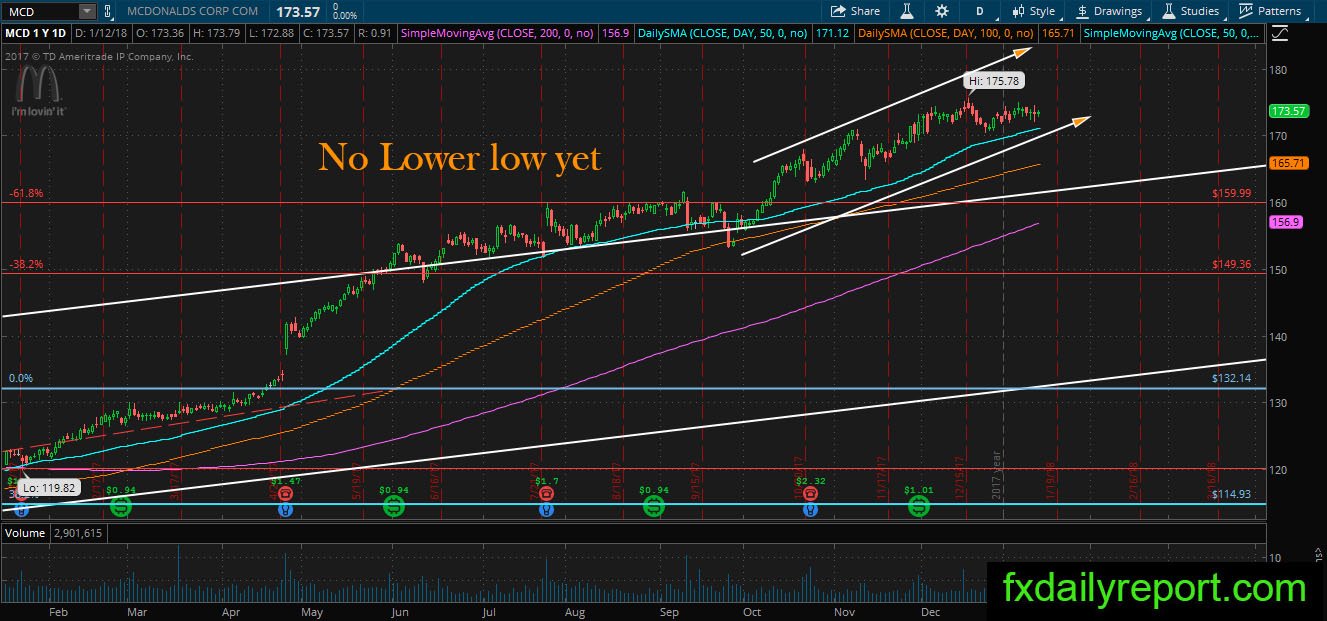
Nothing to discuss yet on MCD daily chart. The share prices continue print higher high and higher low. There is no lower low which tells the bear to stay away. Traders could look for long position near the daily SMA 50.
Trade plan
The long position could be taken near $160.00 breakout level on the weekly chart or daily SMA 50.
The short position might need to wait until major bearish reversal pattern formed on the monthly chart. The current trend is bullish, and it is better to avoid short position. (Same strategy as previous analysis)