
MCD Long-term outlook
MCD share prices tumbled since the start of 2018 and the gaining downward momentum each month. There is no bottom seen yet under the current situation. The pullback in share prices is severe but widely expected as there is no significant retracement since MCD rally from $110.00 in 2016.
This month forward, the share prices movement might be heavily influenced by geopolitical issue and The Fed interest-rate outlook. The hottest issue right now is the trade tariff imposed by President Trump on imported aluminum and Steel. Reaction from U.S counterpart could lead to a trade war and might affect MCD operation worldwide.

Read McDonald January 2018 analysis
New Month
Monthly chart
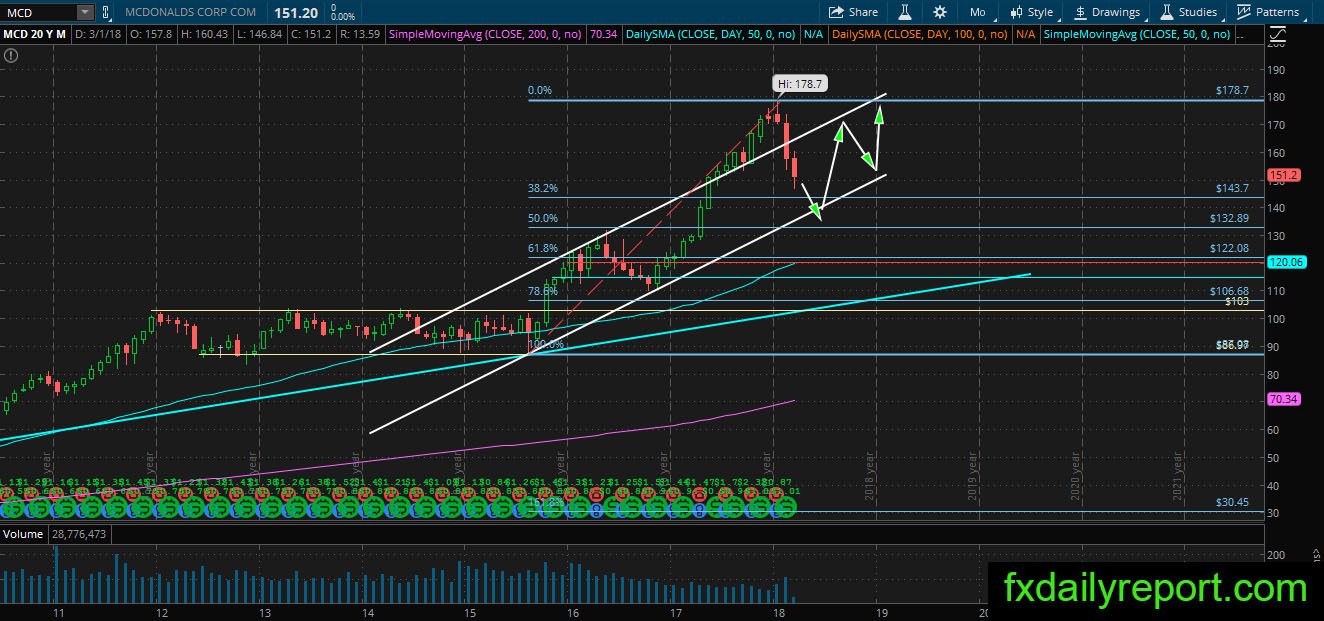
MCD finally make a significant correction after the continuous run from $110.00 to almost $180.00. The share prices entered its white bullish channel and almost reached the 38.2% Fibonacci Retracement level. The bearish sentiment might continue ideally until MCD reached 50% retracement around $130.00 – $132.89.
Trades could stand pat for now and wait for the chance to enter a long position in the strong company at a discounted price.
Weekly chart
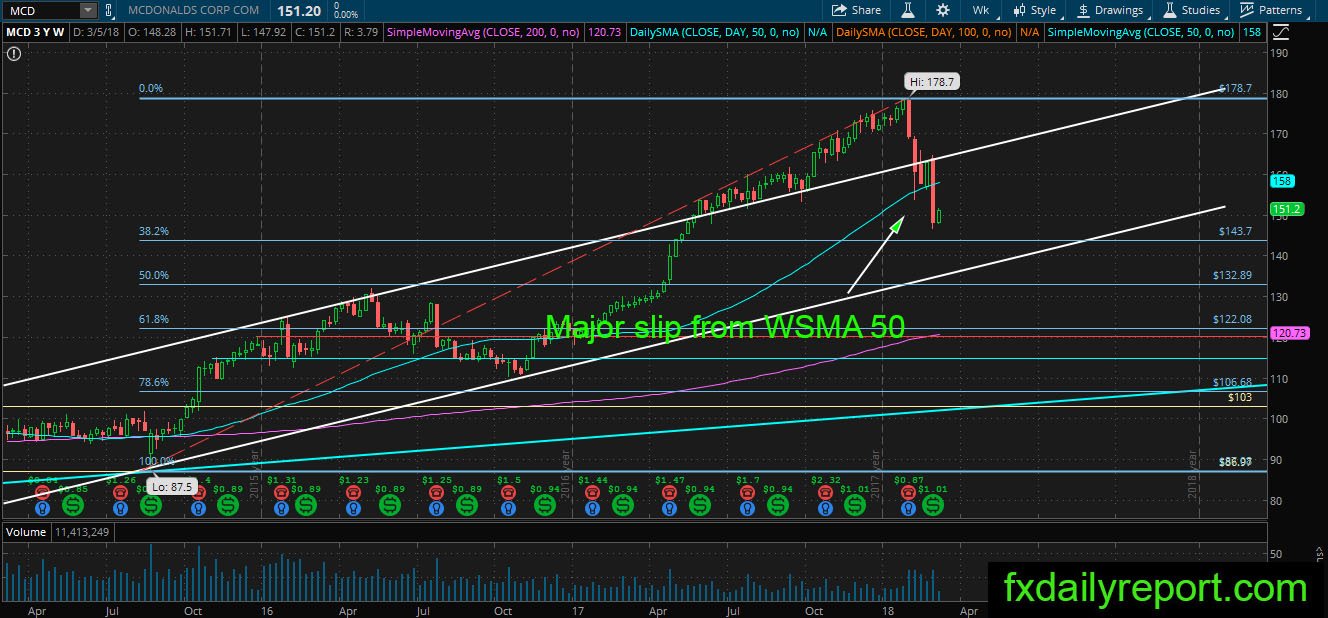
The weekly chart extremely bearish after MCD slipped below its WSMA 50. There is a chance the share prices will bounce upward and test WSMA 50 before continue downside. Traders could look at the reaction and decide to enter a position on strong pattern candlestick formation.
Daily chart
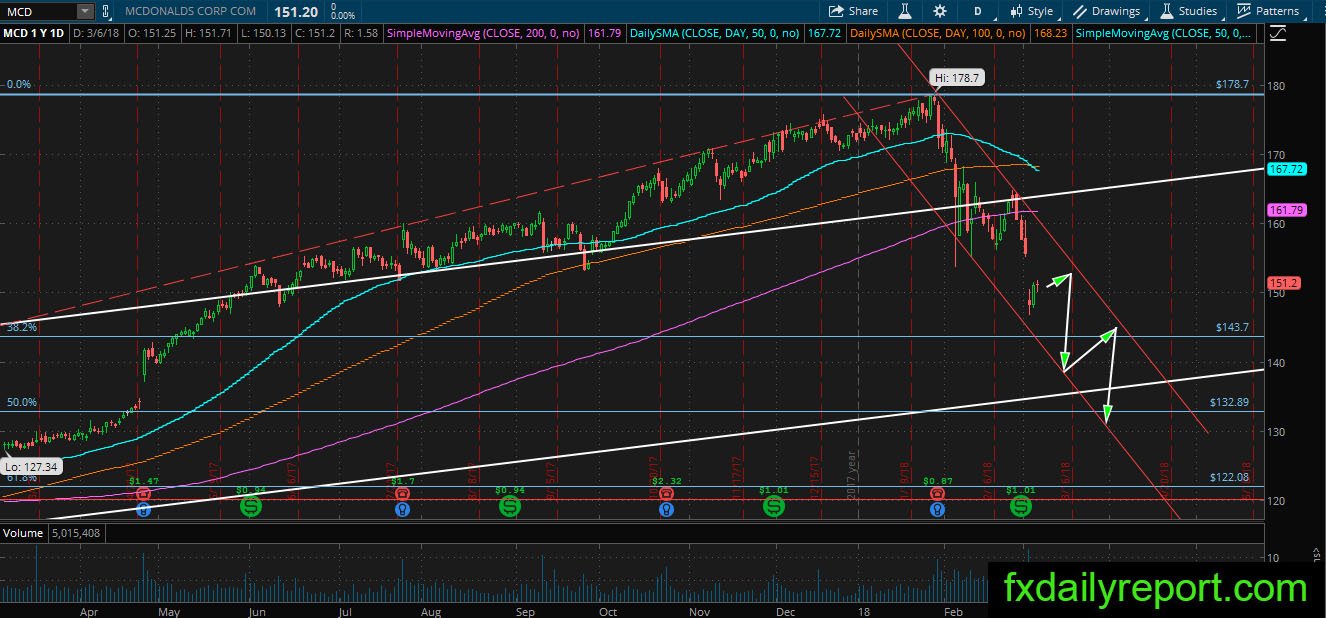
The daily chart of MCD extremely bearish since the share prices break below daily SMA 200. There is no reason to place long position yet under the strong downward momentum. MCD expected to move inside the bearish channel shown on the chart.
Trade plan
The long position needs to wait until the share prices corrected deeper at $130.00 and 50% Fibonacci retracement.
The short position is ideally taken from the top of the white channel. Another place to look for a short position is when the share prices retest weekly SMA 50.