
MCD Long-term outlook
The company is a strong company to watch since the return to the old franchise business model. MCD continue impressed analyst and investors year over year by beating expectation. The company reported earnings per share of $1.79 vs. $1.67 expectation. Revenue comes out at $5,1 billion vs. $4.9 billion expectation.
Total revenue down 26% year over year which is normal as the company steadily reaching its 95% franchise mix (92% in fourth quarter of 2016 and 81% in 2014).

Traders & investors could expect the company continues to perform strongly in the future and the dip in MCD share prices is the time to add more shares.
Read McDonald March 2018 analysis
New Month
Monthly chart
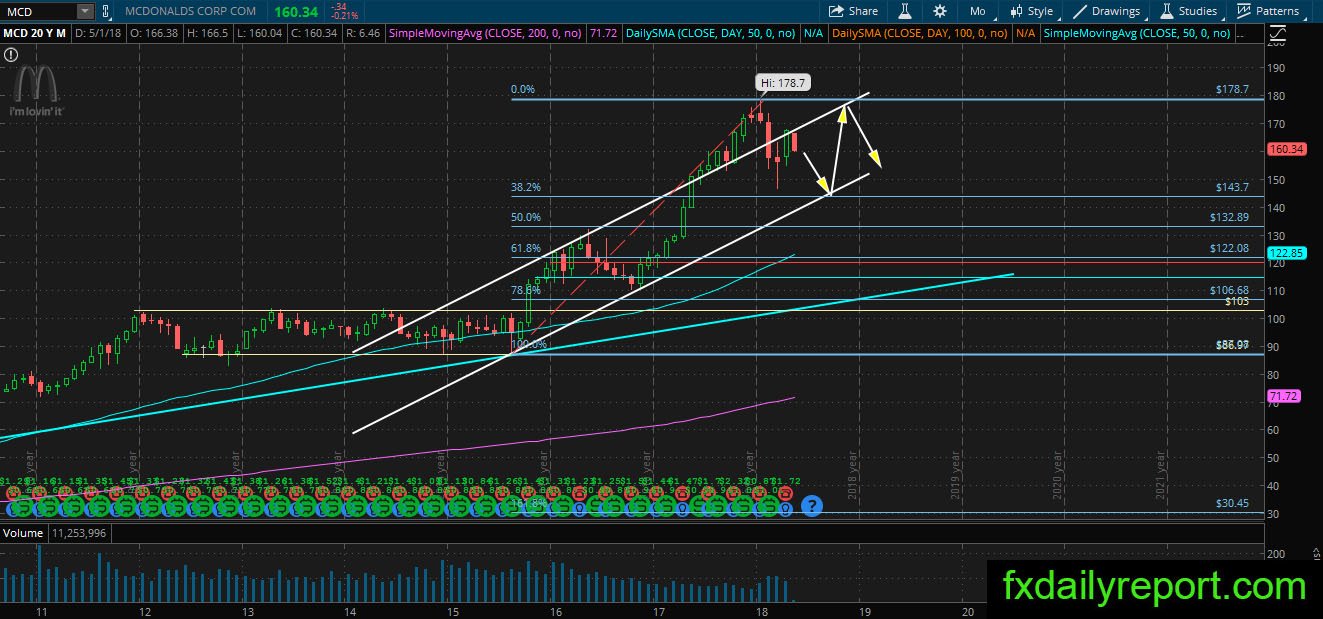
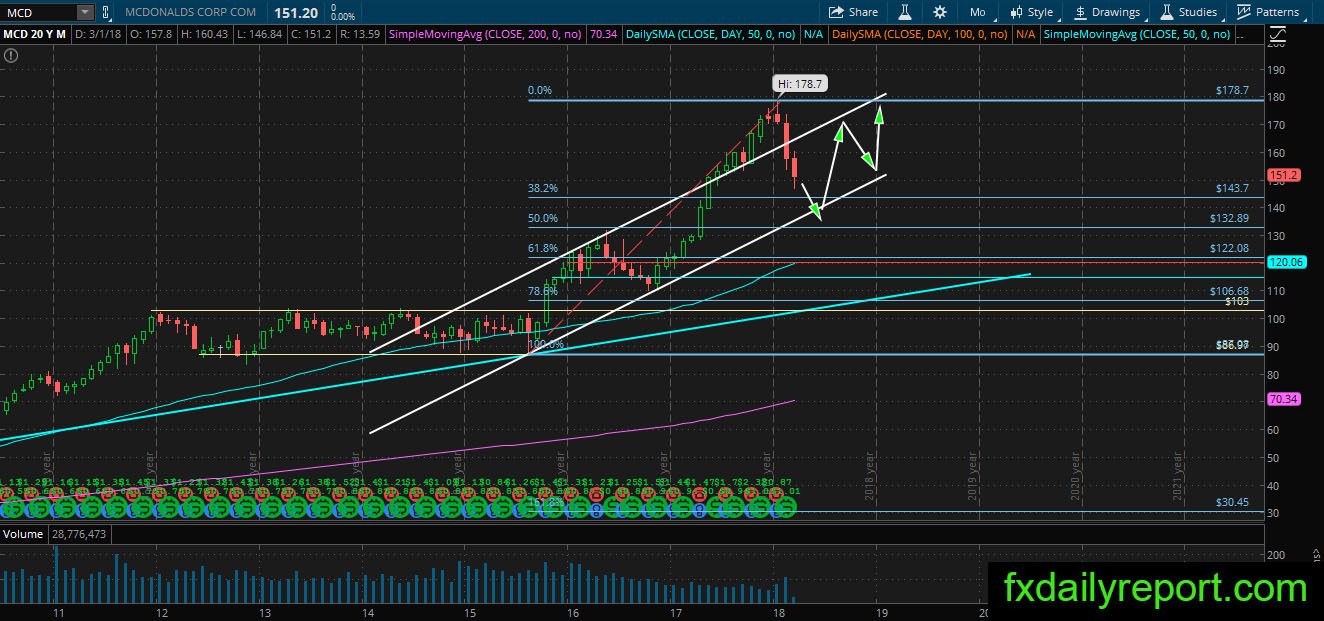
MCD outlook stays above 38.2% Fibonacci retracement and the white channel range. This month, the share prices hit the top of the channel and showing sign of rejection. There is no conclusion yet on this event, but without any buying, it looks like MCD share prices could move down to test the bottom of the white channel.
Traders could continue to stay sideways and wait for the better price to enter MCD.
Weekly chart
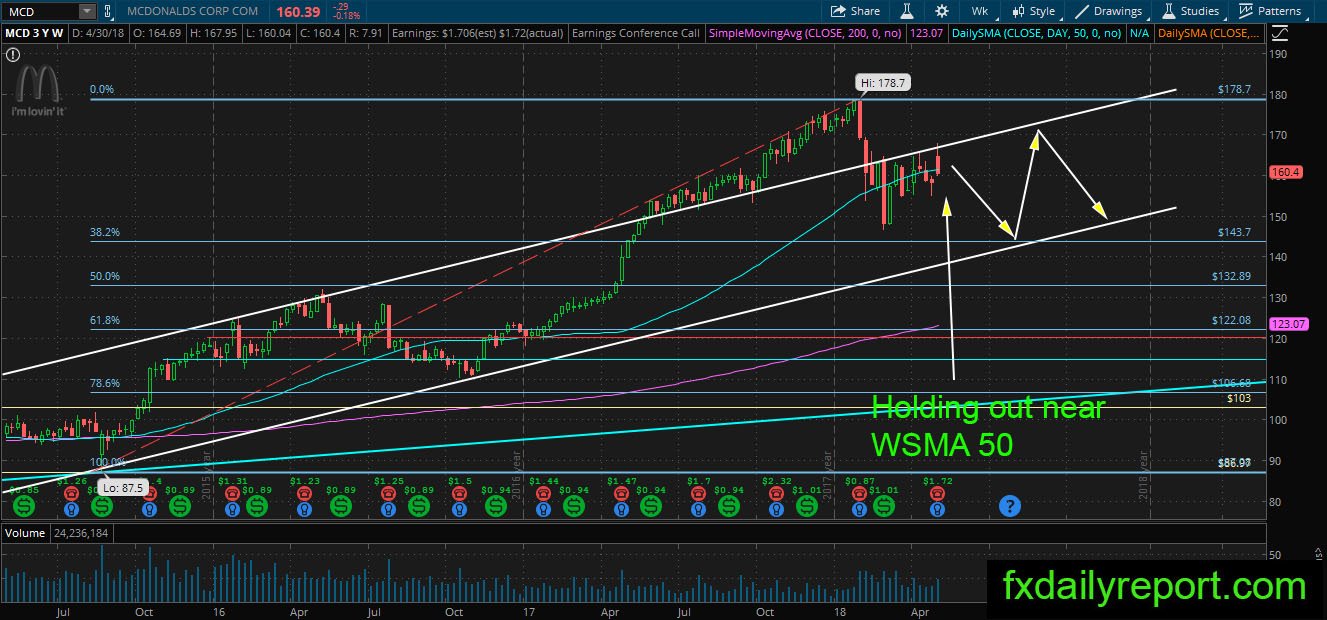
The bounce toward WSMA 50 after MCD slipped below it brought the share price up to the top of the white channel. The share prices continue using the averages as the support level and stick near it. This week, there is strong bearish pressure, but the averages continue protected MCD from further falling.
Depend on the weekly price close, MCD could either continue stick near WSMA 50 or start a new bearish leg toward the bottom of the channel.
Daily chart

The daily chart of MCD show possible cup & handle pattern which is a bullish pattern. The share prices are trading at the last phase of cup& handle pattern. If the pattern confirmed, then we expect MCD will bounce near the red trendline.
Trade plan
The long position needs to wait until the share prices corrected deeper at $130.00 and 50% Fibonacci retracement. (Same strategy for long-term). Long position near the red trendline on the daily chart is another option to take (Short-term strategy).
The short position is ideally taken from the top of the white channel. Another place to look for a short position is when the share prices retest weekly SMA 50. (On progress).