
MCD Long-term outlook
Although MCD regarded as one of the strong company in the U.S stock market. It seems the company share prices have performed in an unexciting way this year. Jim Cramer suggested it is better to own Wendy’s (NASDAQ: WEN) rather than MCD.
Overall, MCD share prices down from $173.73 to $159.18 or down 8.3%. As trader and investors, we will love it if MCD share prices tumble further 20-30% and reach $110 – $120 area to provide us better entry. However, it might be a rare case and might not happen without extreme market situation. But, when it actually happens, traders could prepare and jump in major positions.

Read McDonald May 2018 analysis
New Month
Monthly chart
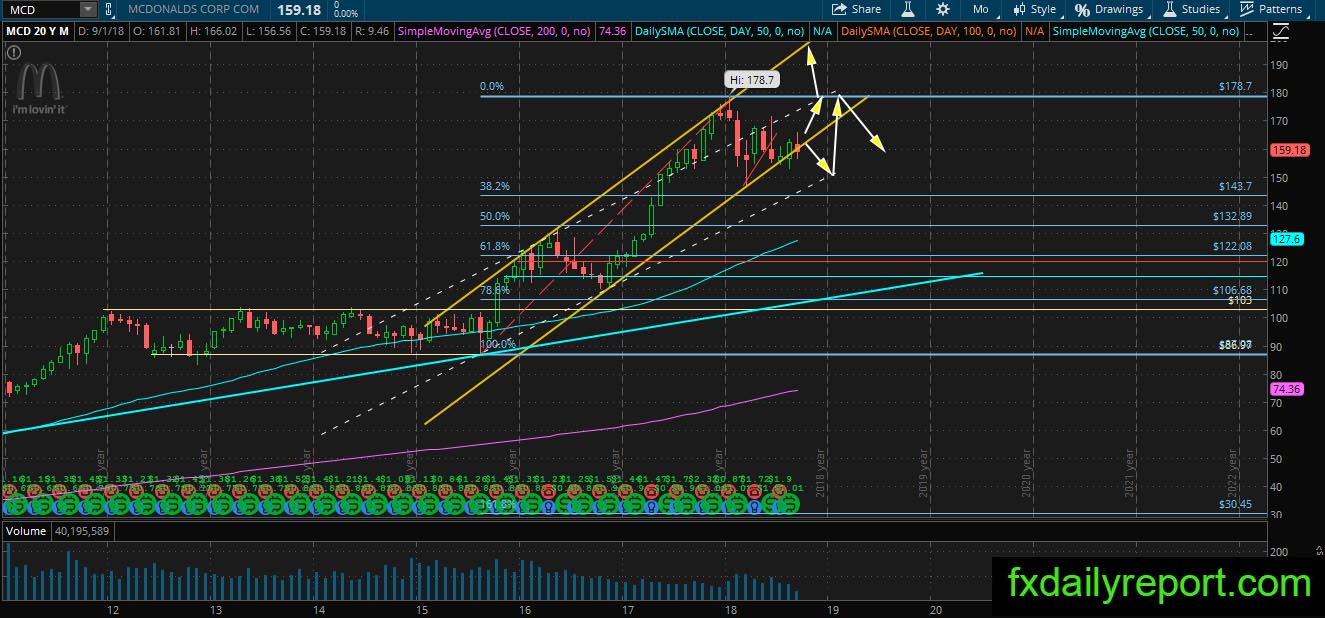
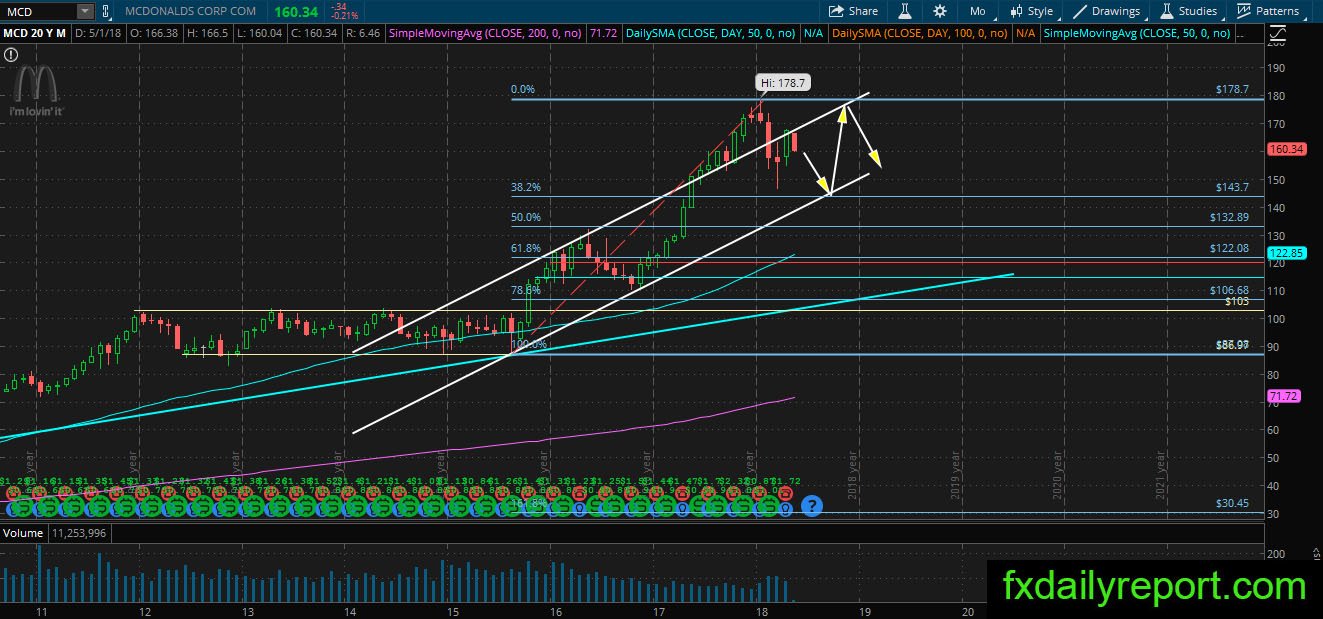
MCD monthly chart showed a correction which happened after the share prices hit the top of the white channel on the right chart. (We repainted the white channel to the dashed channel for easier analysis). There is another channel shown on the chart which has a steeper angle. The share prices currently testing the bottom of the channel. If the bull could maintain the position then we might see a bounce from the bottom of the channel.
Weekly chart
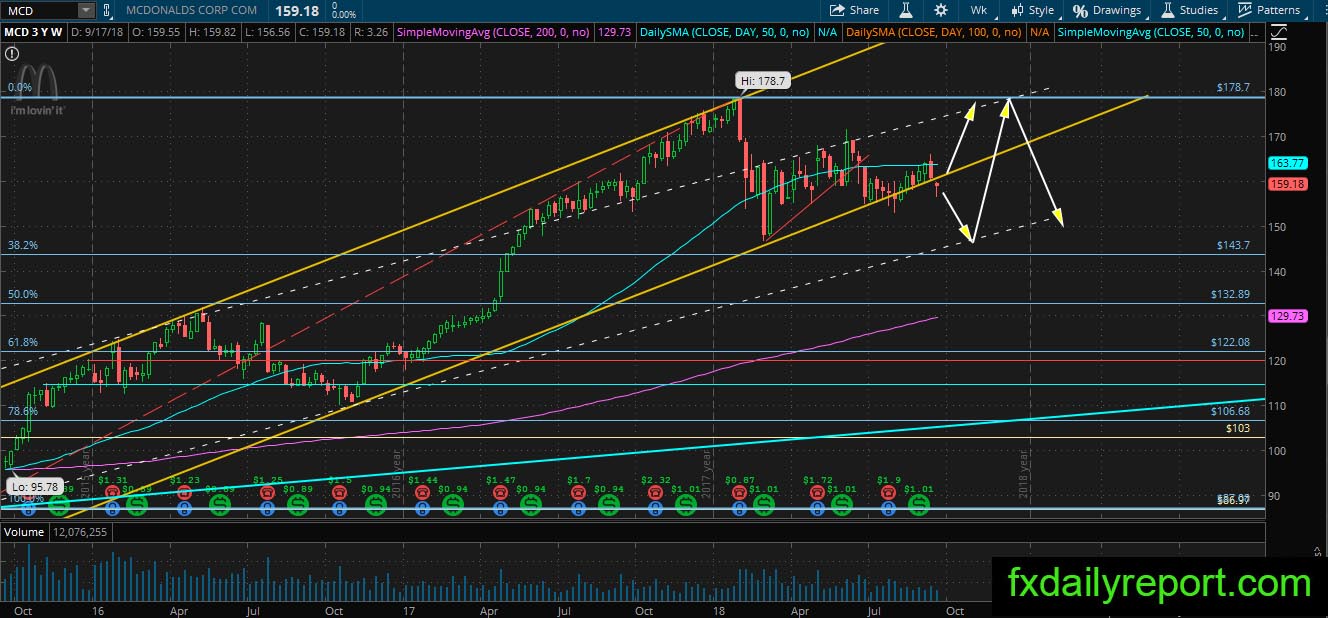
Zooming in the weekly chart, we could see MCD share prices losing ground and slip below the bottom of the channel. The bull still has the chance to bring the share prices back inside the channel by the end of the week. Will the bull manage to return the share price inside the channel?
Daily chart

The daily chart of MCD showed us a possible triangle pattern. It is a sideways pattern, but we think MCD might have turned bearish after the share prices move below SMA 200 and have a hard time to move back above the averages. Recent bearish leg erased 23 days rally in just three days. It is clearly the bear who has upper hand.
Trade plan
The long position needs to wait until the share prices corrected deeper at $130.00 and 50% Fibonacci retracement. (Same strategy for long-term).
The short position could be taken near the daily SMA 200.