
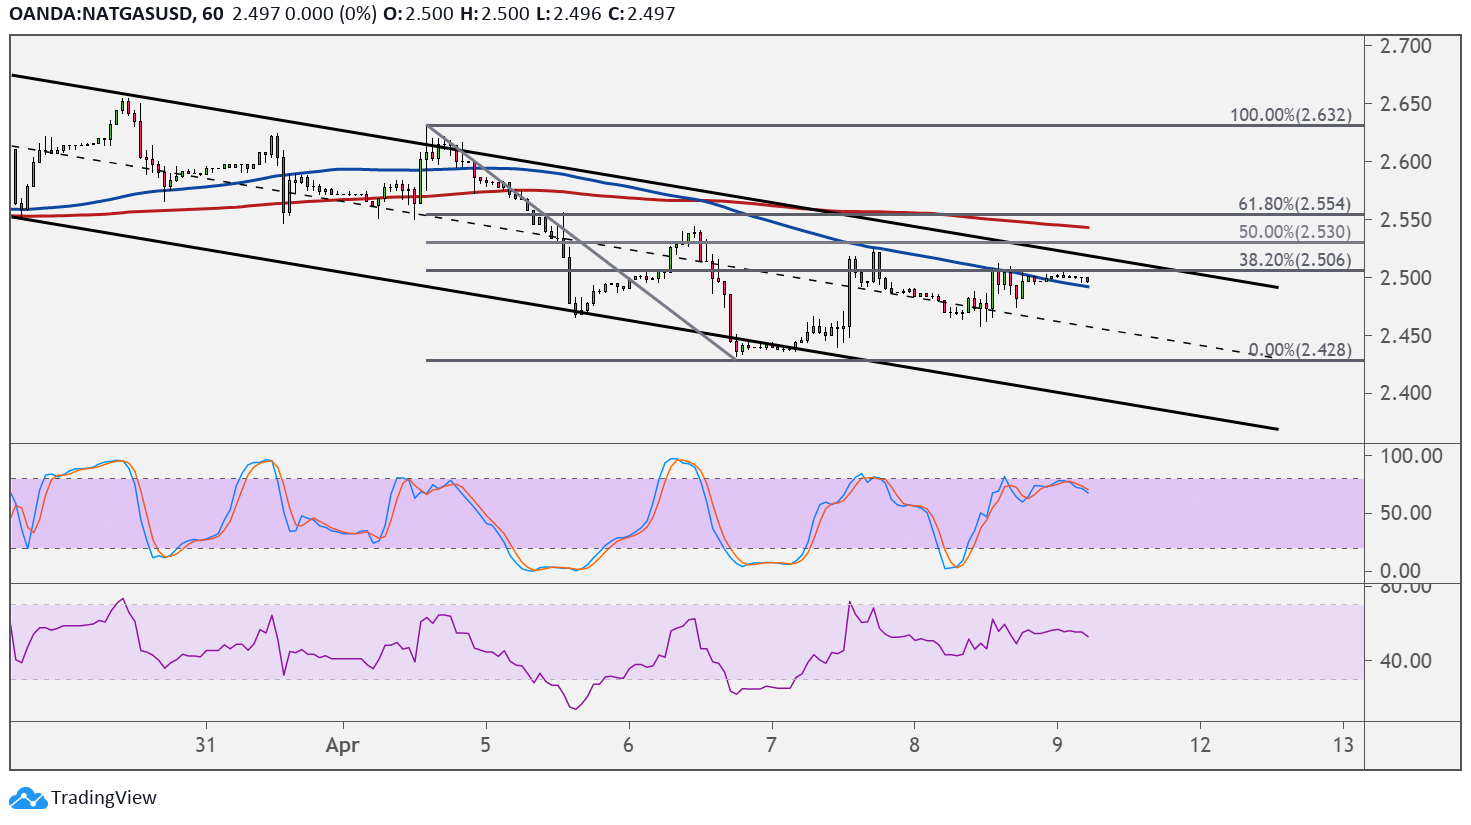
Natural gas is trending lower on its 1-hour chart, moving inside a descending channel and gearing up to test the resistance. This lines up with several inflection points which might be enough to keep gains in check.
In particular, the channel top lines up with the 38.2% Fibonacci retracement level near $2.500. A larger correction could last until the 50% Fib at $2.530 or the 61.8% Fib near the 200 SMA dynamic inflection point at $2.550.

On the subject of moving averages, the 100 SMA is below the 200 SMA to confirm that the path of least resistance is to the downside or that resistance is more likely to hold than to break. The gap between the indicators is widening to reflect stronger selling pressure.
Price has climbed above the 100 SMA dynamic inflection point as an early indicator of bullish pressure, though, and this might hold as dynamic support moving forward.
Stochastic is already turning lower, though, so selling pressure could be returning from here. The oscillator did not even reach the overbought zone, suggesting that sellers are eager to take over. RSI also seems to be cruising lower to signal the presence of bearish momentum as well.
Natural gas is under weaker footing as temperatures are starting to rise in several parts of the US, signaling the end of the winter season. The latest inventory report from the Department of Energy showed a build of 20 Bcf versus the estimated rise of 22 Bcf and the earlier gain of 14 Bcf, reflecting a slowdown in demand.
Output may have also been elevated as producers ramped up operations following temporary shutdowns in the earlier months. Risk-off flows related to pandemic concerns might keep a lid on commodity rallies while a return in risk-taking coming from optimism around vaccination efforts might keep the commodity afloat.