
Natural gas is currently trading inside a descending channel on the short-term time frame, with price hovering around the $2.936 area after recently bouncing off the swing low near the $2.847 level.
The ongoing correction appears to be gaining some traction, but potential resistance at the Fibonacci retracement levels could keep the bearish pressure intact.

The Fibonacci retracement tool drawn from the recent swing high to the $2.847 low shows where sellers could be waiting to rejoin the downtrend. The 38.2% Fib is located at $2.959, which lines up closely with current price action and could attract early sellers.
A deeper bounce could reach the 50% level at $2.993, which coincides with the descending channel midpoint and nearby moving average dynamic resistance. A larger correction could extend all the way to the 61.8% Fib at $3.028, which aligns with the upper boundaries of the channel and could serve as the line in the sand for bearish continuation.
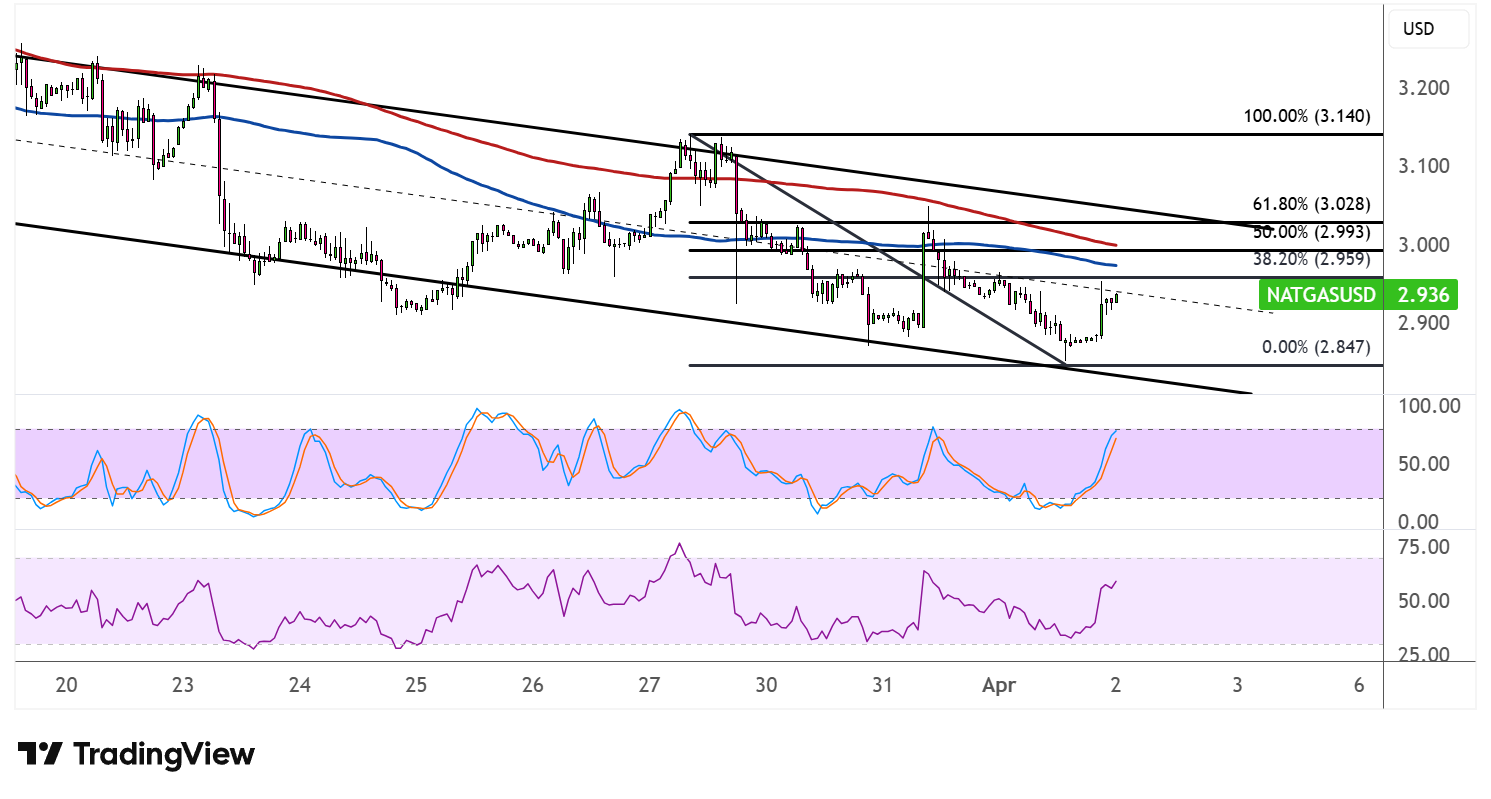
The 100 SMA remains below the 200 SMA, confirming that the path of least resistance is to the downside and that the broader selloff could remain in play. Both indicators are sloping lower and could reinforce the Fibonacci levels as dynamic ceilings on any corrective bounce.
Stochastic has climbed sharply from the oversold region and is approaching overbought territory, suggesting that bullish momentum from the bounce is already fading. Turning lower from here would signal a return of selling pressure and a potential resumption of the slide toward the channel bottom and swing lows around $2.847 or lower.
RSI is also recovering from its recent trough but still has room to climb before reaching overbought conditions, meaning sellers may need to wait a little longer before reasserting full control. However, if RSI stalls and rolls over near the midpoint, that could confirm bearish momentum is returning and that natural gas is set to extend its losses inside the descending channel.