
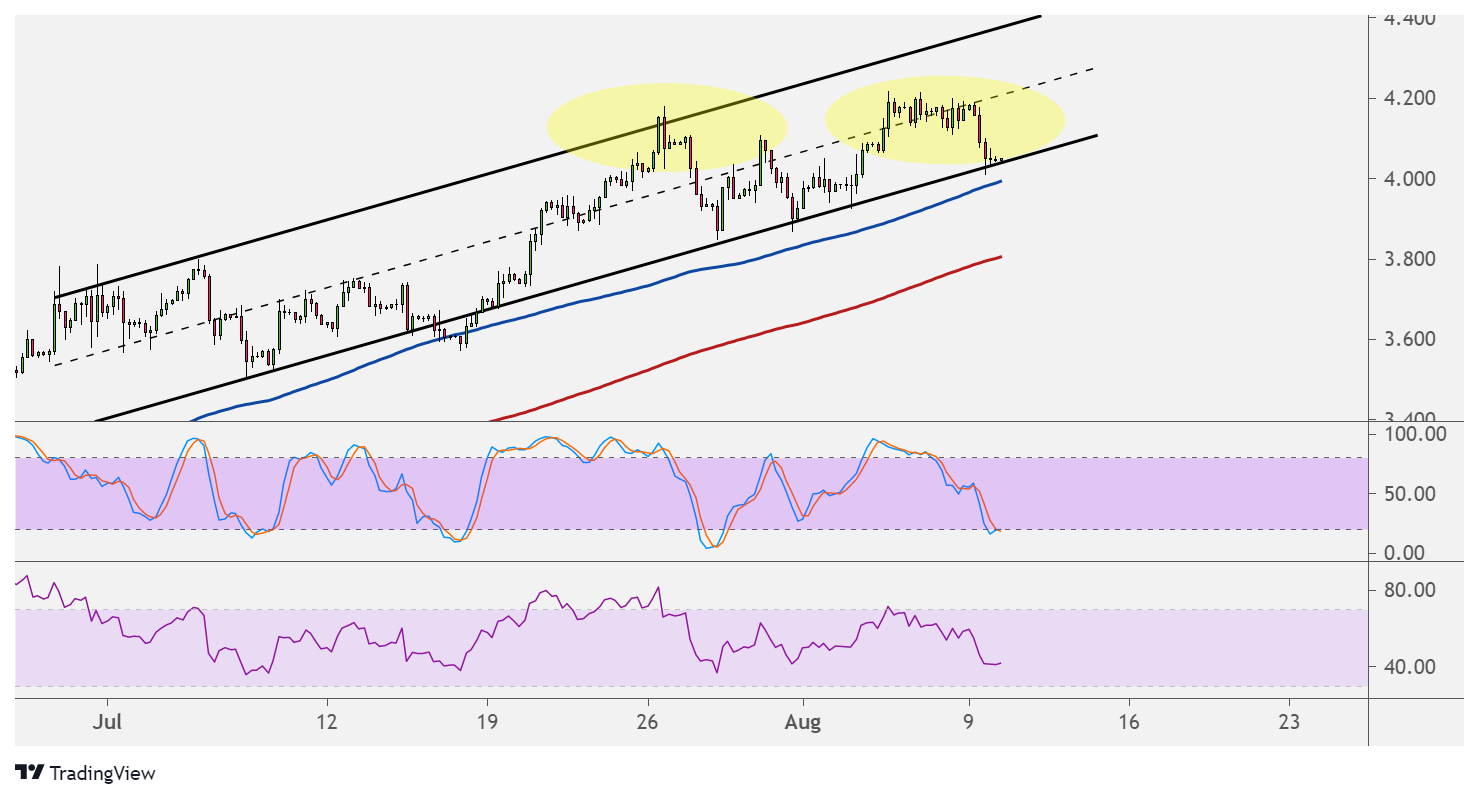
Natural gas found resistance at its mid-channel area of interest and is back down to the ascending channel support at $4.000. If this keeps holding, price could carry on with its climb.
A break below the major psychological support, on the other hand, could mean a reversal from the uptrend. After all, a double top pattern can be seen, with the neckline around the $3.800-3.900 region. A break below this could set off a drop that’s at least the same height as the chart pattern.

However, the 100 SMA is still above the 200 SMA to indicate that the path of least resistance is to the upside or that support is more likely to hold than to break. In that case, a bounce off current levels could take natural gas up to the middle of the channel at $4.200 or the top at $4.400.
Stochastic is still heading lower to show that sellers are in control, but the oscillator is closing in on the oversold region to signal exhaustion. RSI has more room to head south, so natural gas price could keep following suit.
Forecasts of cooler weather are currently weighing on natural gas prices, as this could mean lower demand for cooling commodities.
“We do still see above-normal heat in the Midwest to East as we head into the final third of the month, however, so the forecast as a whole remains bullish versus even the five-year average, just slightly less so than we had previously,” Bespoke Weather Services said.
The upcoming inventory data from the Department of Energy could show another small increase in stockpiles if purchases had been supported in the reporting period or supply remained subdued. A drop in demand, on the other hand, might be reflected in a larger build compared to the earlier 13 Bcf increase.