
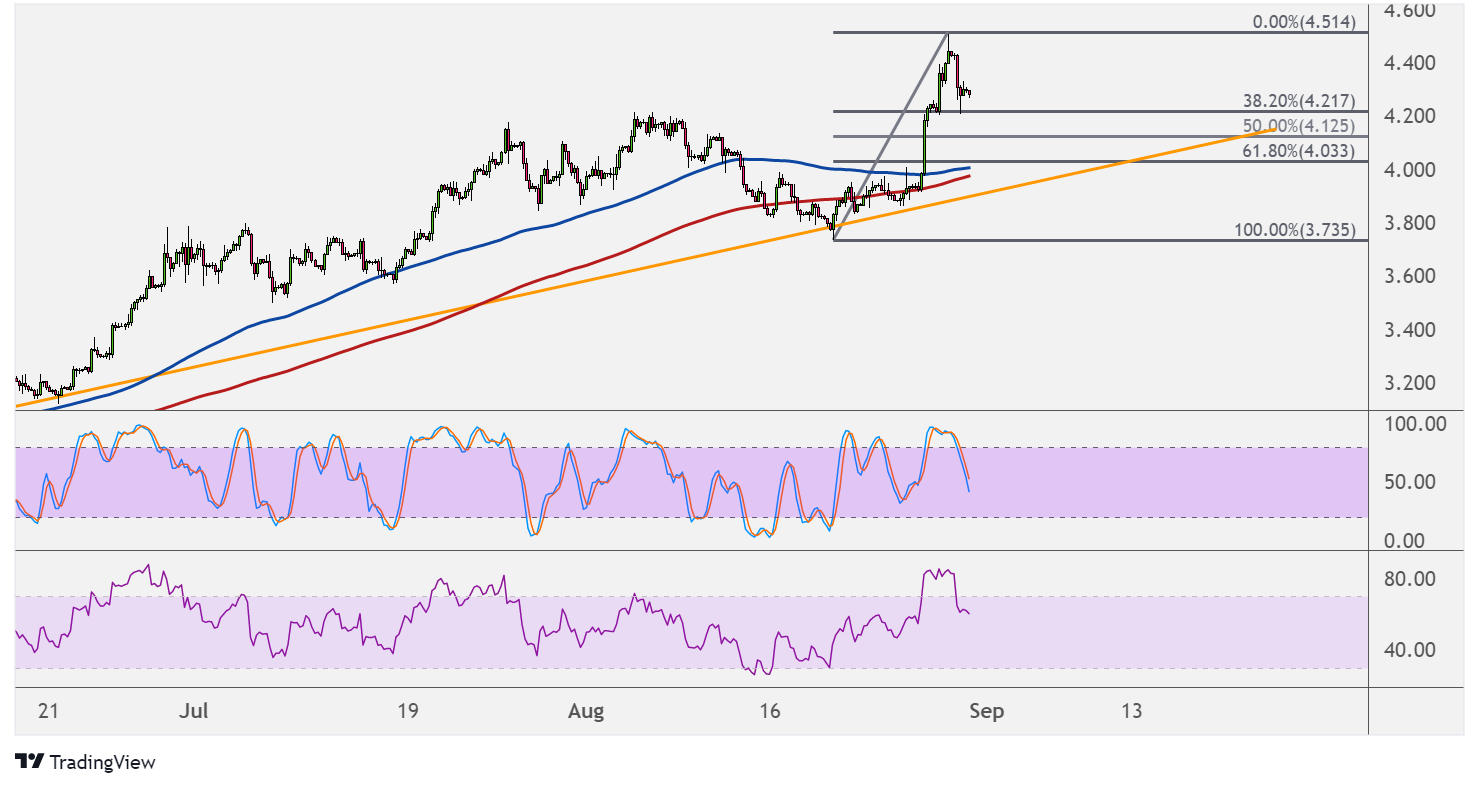
Natural gas is trending higher on its 1-hour chart, with price cruising above a rising trend line that’s been holding since the third week of July. Price looks due for another pullback to this support area.
Applying the Fibonacci retracement tool shows additional levels where buyers might be looking to hop in. The 61.8% level lines up with the trend line around $4.000, which also happens to be a former resistance zone.

This is also in line with the dynamic inflection points at the moving averages. The 100 SMA is above the 200 SMA to confirm that the path of least resistance is to the upside or that support is more likely to hold than to break.
If buyers are eager to hop in, natural gas could already find support at the 38.2% Fib at $4.217 or the 50% level at $4.125.
Take note, however, that the gap between the moving averages has narrowed to reflect weakening bullish momentum. A bearish crossover could confirm that sellers are ready to take over.
Stochastic is heading lower to show that bearish pressure is already in play, and the oscillator is just halfway through on its move down to the oversold region. RSI is also heading south, so price could follow suit while bearish momentum is present.
Natural gas enjoyed a boost on expectations of supply disruptions owing to the weather disturbances like Hurricane Ida. This could lead to another draw in stockpiles, even as warmer temperatures are starting to fade.
The upcoming inventory report from the Department of Energy would likely lead to volatility for natural gas prices midweek. Note that weather forecasts have been mixed recently, so a drop in demand might be observed as the summer season draws to a close.
Still, another large reduction in stockpiles might mean more gains for the commodity.