
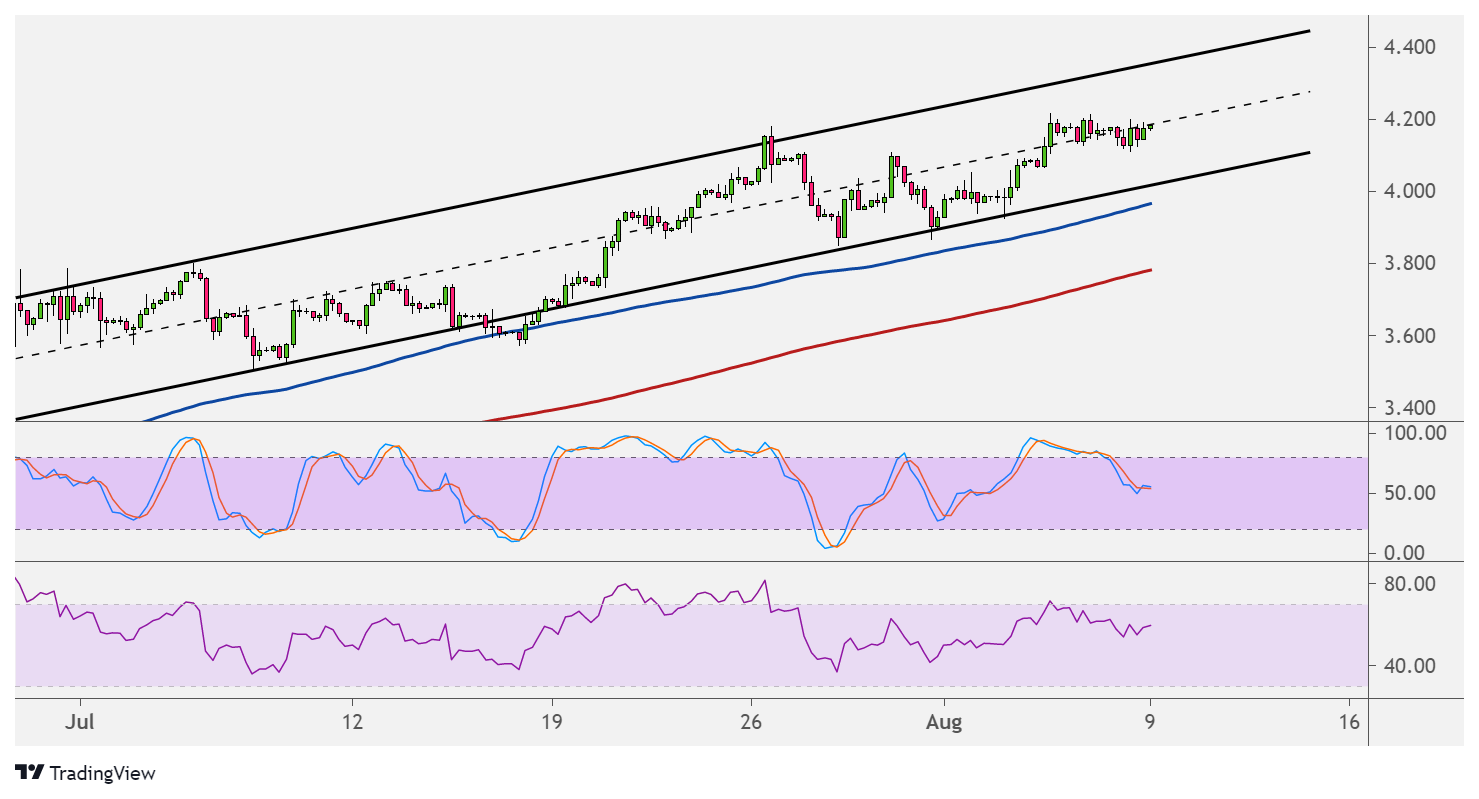
Natural gas continues to trend higher on its short-term chart, but price is stalling at the mid-channel area of interest. A break higher could clear the path for a move up to the resistance at $4.400.
A break lower, on the other hand, could lead to another test of the channel support near the $4.000 major psychological mark. This also lines up with the 100 SMA dynamic inflection point, which adds to its strength as support.

On the subject of moving averages, the 100 SMA is above the 200 SMA to indicate that the path of least resistance is to the upside or that support is more likely to hold than to break.
However, stochastic is on the move down to show that sellers have the upper hand, and the oscillator has plenty of room to drop before reaching the oversold region. RSI is also heading south to show that sellers have the upper hand.
Natural gas drew support from forecasts of warmer weather earlier on, but temperature models are giving mixed projections these days. Keep in mind that demand for the cooling commodity typically picks up during the summer months.
Risk appetite might also be affecting natural gas prices, as the concerns about the Delta variant spread and possible restrictions could weigh on business purchases and consumer activity. Expectations of Fed tapering might also impact investors’ demand for riskier assets like commodities.
The upcoming inventory report from the Department of Energy should have more insights on supply and demand conditions, as another large draw in stockpiles could mean a continuation of the uptrend.
On the other hand, a build in inventories might suggest that demand has peaked and that further declines are likely, possibly resulting in a drop in natural gas prices.