
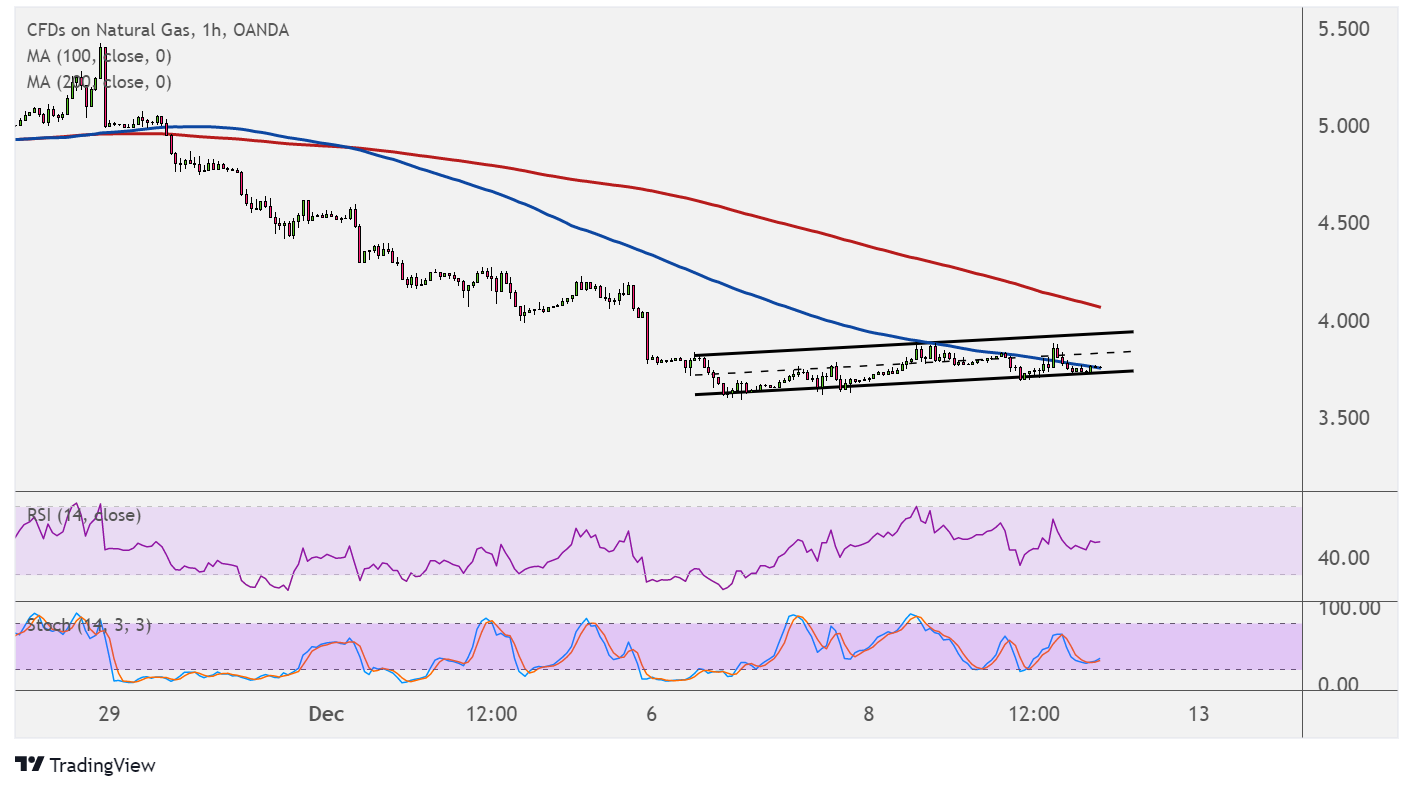
Natural gas is still trending lower, but signs of bullish pressure are showing up. Price is trading inside a small ascending channel visible on its hourly time frame and is testing support.
A bounce off this area could take natural gas back up to the channel top near the $4.000 major psychological mark. On the other hand, a break lower could confirm a continuation of the earlier slide.

The 100 SMA is below the 200 SMA to indicate that the path of least resistance is to the downside or that support is more likely to break than to hold. The gap between the indicators is still wide enough to show that bears could stay in control.
Still, price is attempting to climb above the 100 SMA dynamic inflection point, which might hold as support if bulls continue to charge. The 200 SMA dynamic resistance is just above the channel top to add another layer of resistance.
RSI is on middle ground to reflect consolidation and might be due to turn lower to signal a return in selling pressure. Stochastic appears to be on the move down as well, indicating that bearish momentum is present.
Natural gas is pulling slightly higher as winter season is setting in some parts of the US. This could mean an increase in demand for the heating commodity moving forward.
However, forecasts of warmer than usual temperatures could keep a lid on natural gas demand or might delay the pickup in purchases. Supply could stay supported as producers are ready to ramp up output to meet winter demand.
The latest inventory report printed a draw of 59 Bcf, slightly smaller than the projected reduction of 60 Bcf and in line with the previous week’s draw. Risk sentiment could push commodity prices around in the next few days.