
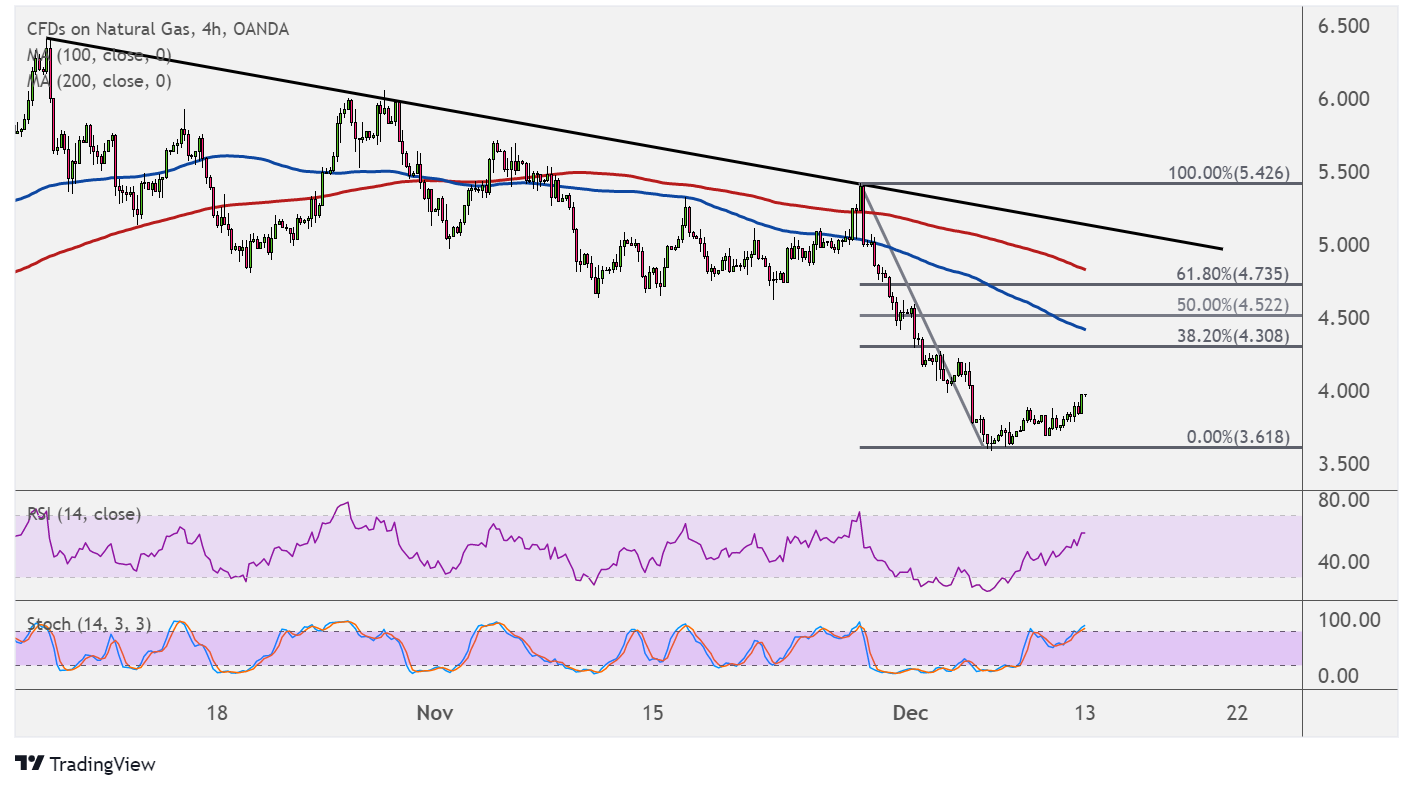
Natural gas is in correction mode from its slide, and the Fibonacci retracement tool on the 4-hour time frame shows where more sellers might join in.
The 61.8% level lines up with a former short-term support level around the $4.735 mark and the 200 SMA dynamic inflection point. The 50% Fib is near $4.500 while the 38.2% level is at $4.308. If any of these hold as resistance, natural gas could resume the slide to the swing low at $3.618 or lower.

The 100 SMA is below the 200 SMA to indicate that the path of least resistance is to the downside or that the selloff is more likely to resume than to reverse. The gap between the moving averages is even widening to reflect strengthening selling pressure.
RSI has some room to climb before indicating overbought conditions, so buyers could stay in the game for a bit longer. Stochastic is already dipping into the overbought zone to signal exhaustion among buyers, and turning lower would confirm that sellers are taking over.
Natural gas is drawing some support as investors anticipate an increase in demand due to colder weather in the past few days. Although there are forecasts for a warmer than usual start to the winter season, purchases might still pick up if consumers are anticipating more price gains down the line.
The upcoming inventory report from the Department of Energy should provide increased volatility for natural gas later in the week, but traders might also take cues from overall market sentiment.
Catalysts for a shift in risk appetite include the FOMC decision, along with other central bank statements. A more cautious outlook among policymakers could bring risk-off flows back to the table, as central banks would likely weigh the impact of the Omicron variant versus rising price pressures.