
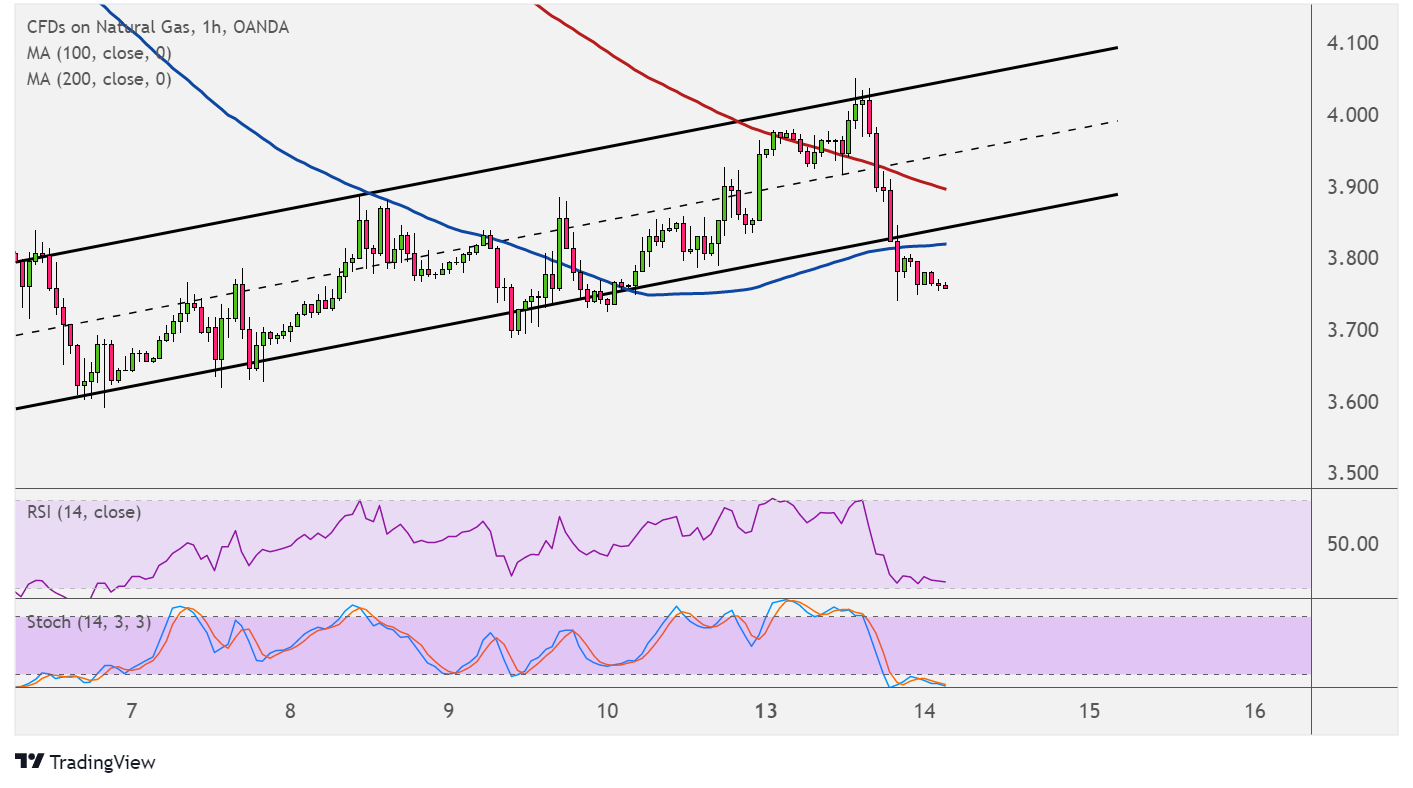
Natural gas broke below the bottom of its ascending channel on the hourly time frame, hinting that a reversal from the uptrend is due. Price is forming a bearish continuation pattern at the moment.
A break below the short-term flag consolidation could set off a drop that’s the same height as the mast, which spans around $3.800 to $4.100. The 100 SMA is below the 200 SMA to confirm that the path of least resistance is to the downside or that support is more likely to break than to hold.

Natural gas has also fallen below both indicators as additional confirmation of selling pressure. However, the gap between the moving averages is narrowing to reflect weakening bearish momentum and a potential bullish crossover.
RSI is edging lower and closing in on the oversold region to reflect exhaustion among sellers. Turning back up would mean that buyers are returning and might lead to a rally back inside the rising channel. Stochastic is in the oversold area, also reflecting exhaustion among bears.
Natural gas is under weak footing as warmer weather forecasts could mean lower demand for heating commodities even at the start of winter season. The upcoming inventory report from the Department of Energy should shed more light on supply and demand conditions in the past week.
Recall that the report printed a draw of 59 Bcf in the previous release, so another sizeable reduction could mean some upside for the commodity. A large build, on the other hand, could mean more downside for natural gas.
Also, the upcoming FOMC decision might spur additional volatility, as any major changes to their economic forecasts and dot plot projection of interest rates would likely affect market sentiment. A return in risk-taking could be bullish for natural gas while risk-off flows could spur losses.