
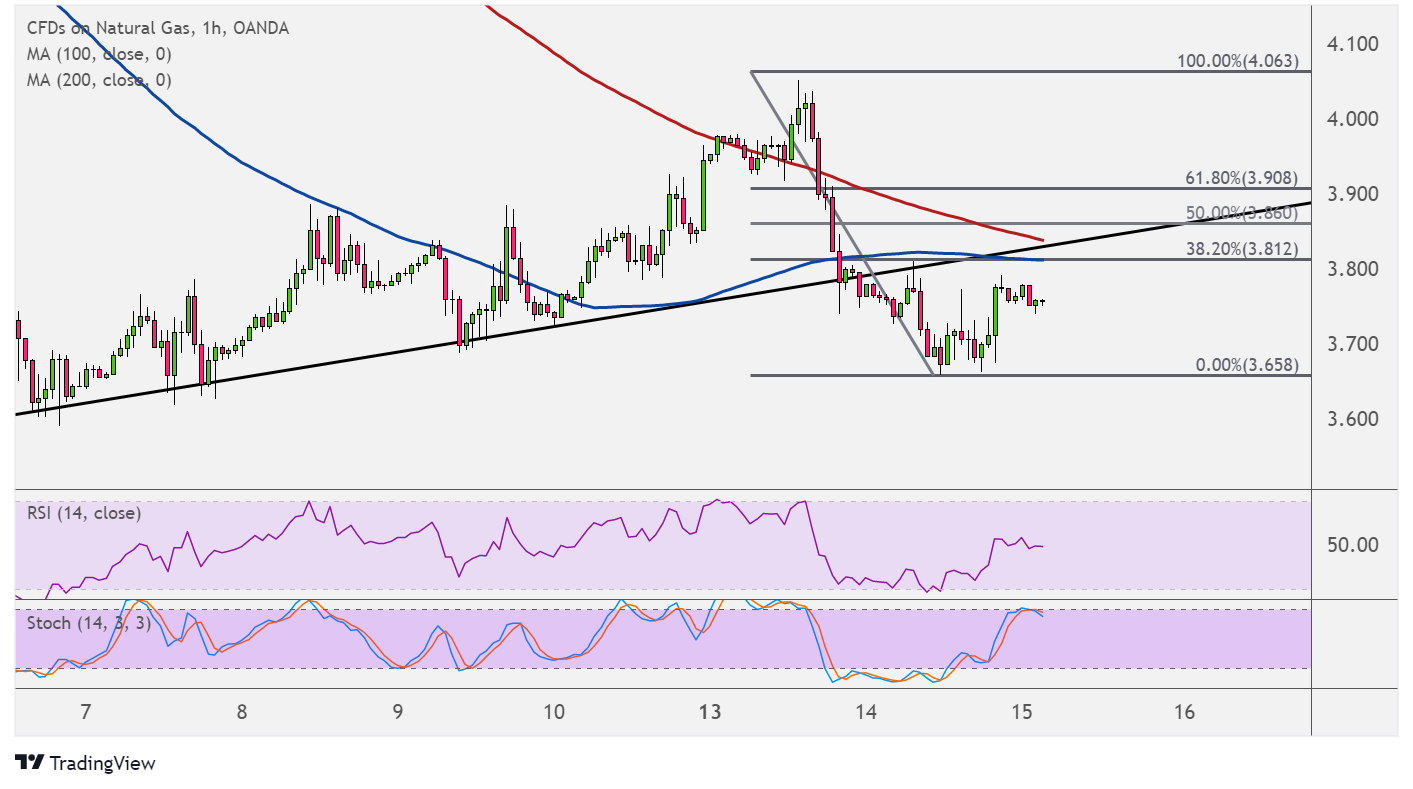
Natural gas recently fell through support at the rising trend line on its 1-hour time frame and looks ready for a retest. The Fibonacci retracement tool shows where sellers might be waiting to hop in.
The 38.2% level is in line with the broken support around $3.815 and the 100 SMA dynamic inflection point. A larger pullback could still reach the 50% Fib at $3.850 or the 61.8% level at $3.908. If any of these hold as resistance, natural gas could slump back to the swing low at $3.658 or lower.

The 100 SMA is below the 200 SMA to confirm that the path of least resistance is to the downside or that the selloff is more likely to gain traction than to reverse. However, the gap between the indicators is narrowing to reflect slowing bearish pressure or a potential bullish crossover.
RSI is still on the move up to show that buyers have some energy left before reflecting overbought conditions or exhaustion. Stochastic is already starting to top out close to the overbought zone, so turning lower would mean that sellers are returning.
Natural gas could be on shaky footing again, as weather forecasts are predicting milder temperatures up ahead. This could mean a lackluster start to the winter season in terms of demand for heating commodities.
The upcoming inventory report from the Department of Energy should shed more light on supply and demand conditions, as a draw in stockpiles would signal that purchases have already picked up. On the other hand, a large build would suggest that output is keeping up with demand.
As it is, the US has plenty of natural gas in storage to meet the likely surge in purchases towards the end of the year and early next year. Elsewhere around the globe, like in Europe, inventories were about 20% below normal for this time of year.