
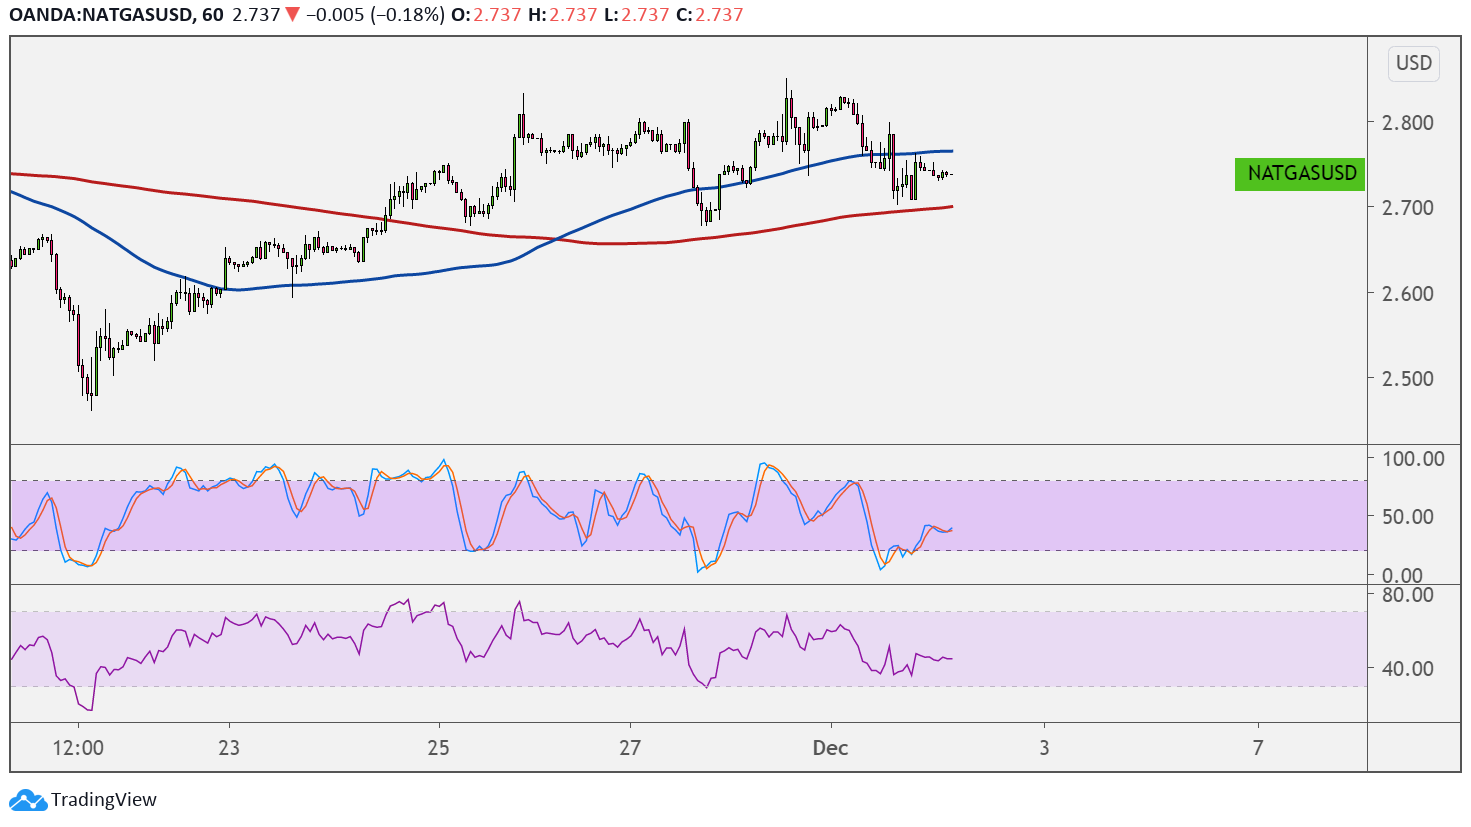
Natural gas could be in for a reversal from its climb as price formed a double top pattern on its 1-hour chart. Price has yet to break below the neckline at $2.700 to confirm the downtrend.
The chart pattern spans around $0.100 so the resulting drop could be of the same height, taking natural gas to $2.600. However, the 100 SMA is still above the 200 SMA to indicate that the path of least resistance is to the upside or that support is more likely to hold than to break.

Also, the gap between the indicators is widening to reflect stronger bullish momentum. Price is below the 100 SMA as an indicator of early bearish pressure but is above the 200 SMA, so this could still hold as dynamic support.
Stochastic is turning higher after recently pulling out of the oversold region, indicating a return to bullish momentum. RSI is treading sideways to reflect consolidation, barely offering any directional clues at the moment.
Natural gas appears to be holding out for more catalysts as traders await the release of the latest inventory numbers. A reduction in stockpiles could be bullish for the commodity as this would confirm sustained demand amid cooler weather conditions.
A build, on the other hand, could signal weakening purchases or potential oversupply. Note that a number of facilities have resumed production after weather disturbances have disrupted output in the past month. So far, no major hurricanes are affecting production along the Gulf coast in the past few days.
Meanwhile, any changes in risk sentiment could also impact the commodity’s movements as risk-on flows could be bullish for the commodity while risk aversion tends to be bearish. Traders are particularly focused on vaccine developments as odds of one being widely available soon could allow a return to normal business conditions right away.