
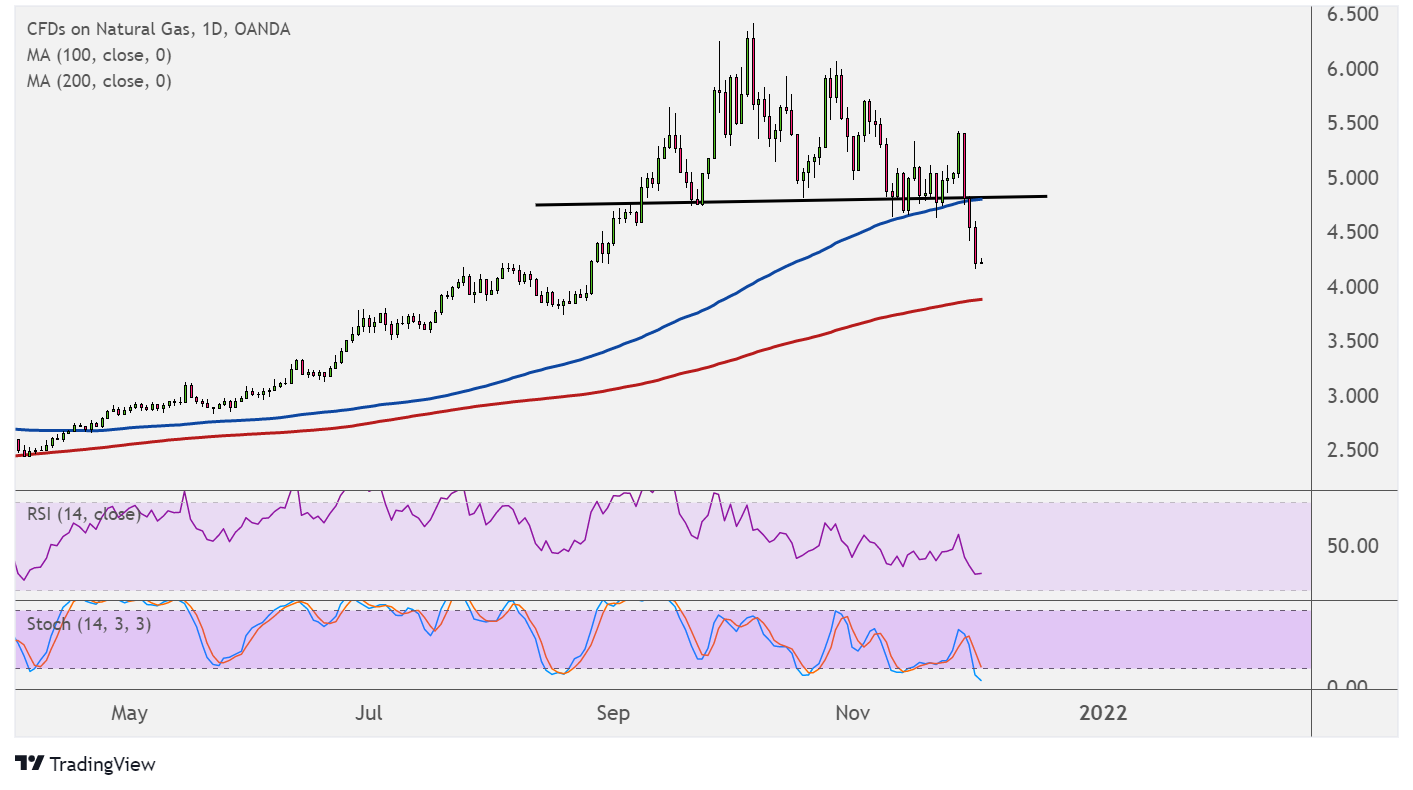
Natural gas broke below the neckline of its head and shoulders pattern on the daily time frame, confirming that a long-term reversal is underway.
Price also broke below the 100 SMA dynamic inflection point as an early indication of selling pressure. The 100 SMA is still above the 200 SMA to indicate that the path of least resistance is to the upside or that there’s a chance the rally could resume.

After all, natural gas has yet to test support at the 200 SMA dynamic inflection point, and the gap between the indicators is widening to reflect strengthening bullish momentum.
RSI has some room to head south before reflecting oversold conditions or exhaustion among sellers. Turning back up would mean that buyers are ready to take over soon. Stochastic is already dipping into the oversold region to signal that sellers need a break and might allow buyers to return.
If that’s the case, natural gas could still pull up for a retest of the broken neckline support around $5.000 before heading further south. Note that the chart pattern spans around $5.000 to $6.500, so the resulting drop could be of the same height.
Commodities like natural gas are on weak footing these days owing to the return in risk aversion. This has been spurred by the detection of the Omicron variant, which has prompted some nations to impose travel restrictions again.
This could lead to another wave lower for business and consumer activity, just as some economies are starting to reopen and recover from the pandemic. If the variant shows resistance to vaccines, more lockdown measures could be announced and this could weigh on overall demand for risk.
The upcoming inventory report should provide some near-term volatility, with a build in stockpiles possibly spurring more losses for natural gas. On the other hand, a reduction could spark a quick rally.