
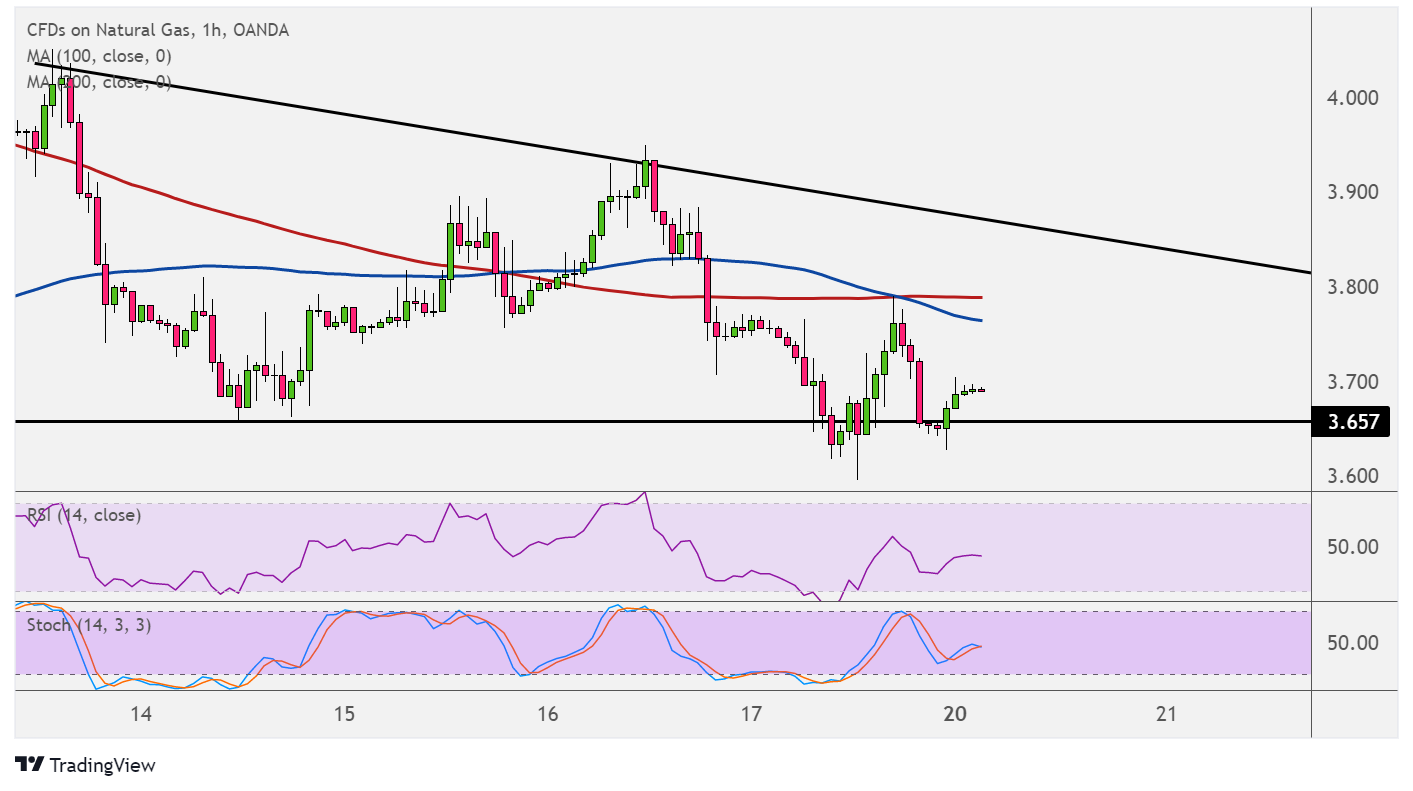
Natural gas has formed lower highs and found support at $3.650, creating a descending triangle on its hourly time frame. Price is bouncing off support and could be due for a move back to the resistance around $3.800.
However, the 100 SMA is below the 200 SMA to indicate that the path of least resistance is to the downside or that support is more likely to break than to hold. If that’s the case, natural gas could slide by the same height as the chart formation, which spans $3.650 to $4.000.

Then again, the moving averages might simply be oscillating to reflect consolidation. With that, there’s still a chance that price could keep moving sideways inside the triangle pattern for a while.
RSI appears to be on the move up to show that buyers have the upper hand, and the oscillator has plenty of room to climb before reflecting overbought conditions. Stochastic, on the other hand, is turning lower to show that sellers have some energy to push natural gas price further south.
Natural gas is still drawing some support on cooler weather forecasts, but traders might hold out for the actual temperatures before making adjustments to their positions. Demand remains elevated, as winters season is starting and could continue to lift purchases of heating commodities until early next year.
Even lower temperatures could mean stronger upside for natural gas, especially as demand is starting to pick up in other parts of the globe where supply remains limited. Domestic supplies could be sapped by exports to Europe and China if the energy crunch persists.
However, risk appetite remains weak these days, as traders are wary of the Omicron variant and its potential impact to global growth. In turn, this weighs on investors’ demand for riskier assets like commodities.