
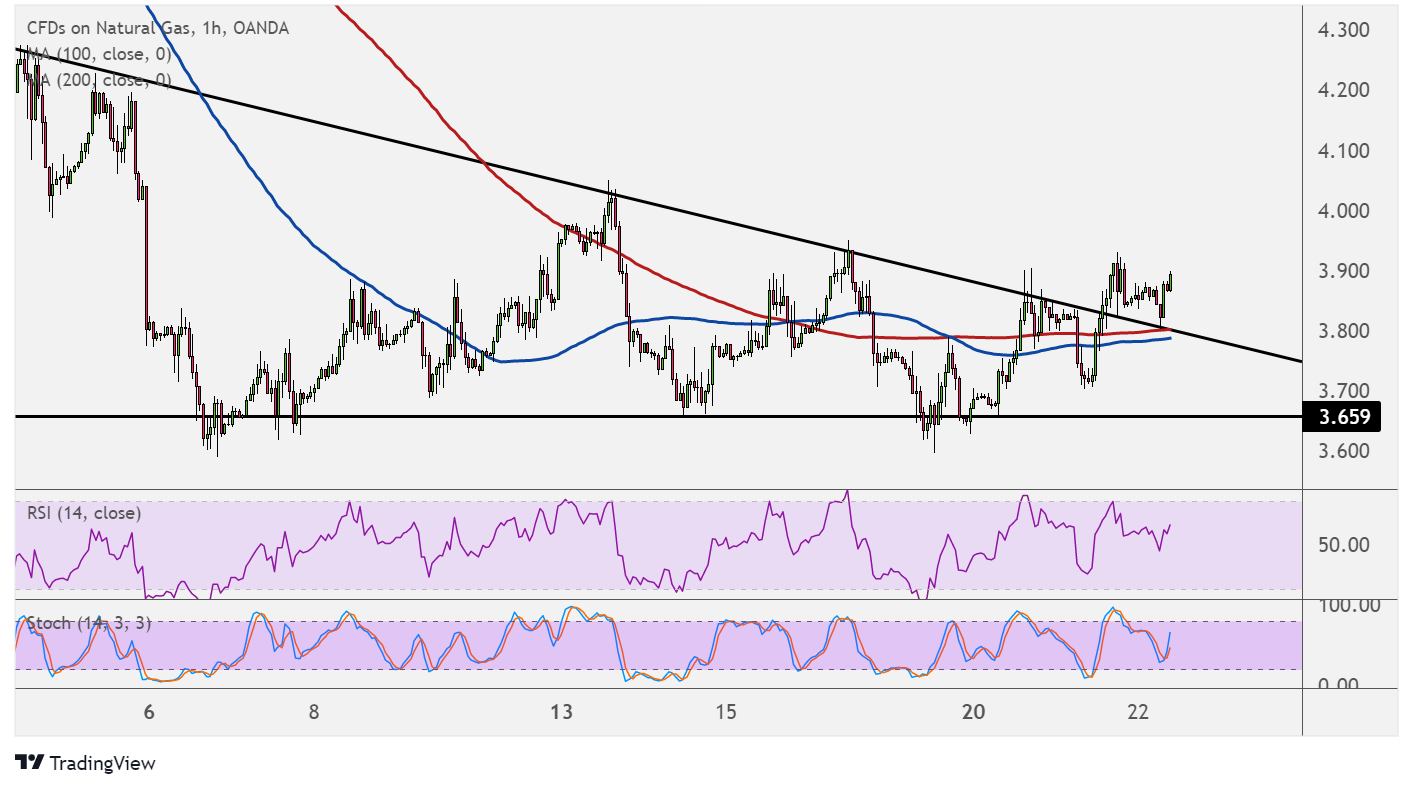
Natural gas was previously consolidating inside a descending triangle on its hourly chart, and price already broke above the resistance. This suggests that price could be in for a rally that’s the same height as the chart formation.
However, the 100 SMA is still below the 200 SMA to indicate that the path of least resistance is to the downside or that there’s a chance sellers could return. Then again, natural gas is trading above both moving averages as an early indicator of bullish pressure.

Stochastic is also turning higher without reaching the oversold area, suggesting that buyers are eager to return. RSI is on the move up, so natural gas might follow suit. The triangle chart pattern spans $3.650 to $4.300, so the climb could last by around $0.650.
Natural gas could be starting a new longer-term climb since cooler temperatures are likely to keep demand for heating commodities elevated for the rest of the month until early next year.
The Department of Energy is slated to report a draw of 54 Bcf in the previous week, lower than the earlier reduction of 88 Bcf. This might signal that demand has not picked up as strongly as many expected, although a larger-than-expected draw might mean more upside for the commodity.
A smaller reduction, on the other hand, could keep a lid on natural gas price rallies while a surprise build could result to a decline. Warmer than usual weather conditions and a boost in production might have contributed to a smaller draw in stockpiles.
Risk appetite might also be enough to sustain the commodity’s gains, especially since the Santa Claus rally tends to lift higher-yielding assets before the year comes to a close. However, investors remain wary of the Omicron variant that could continue to weigh on business and investment activity until 2022.