
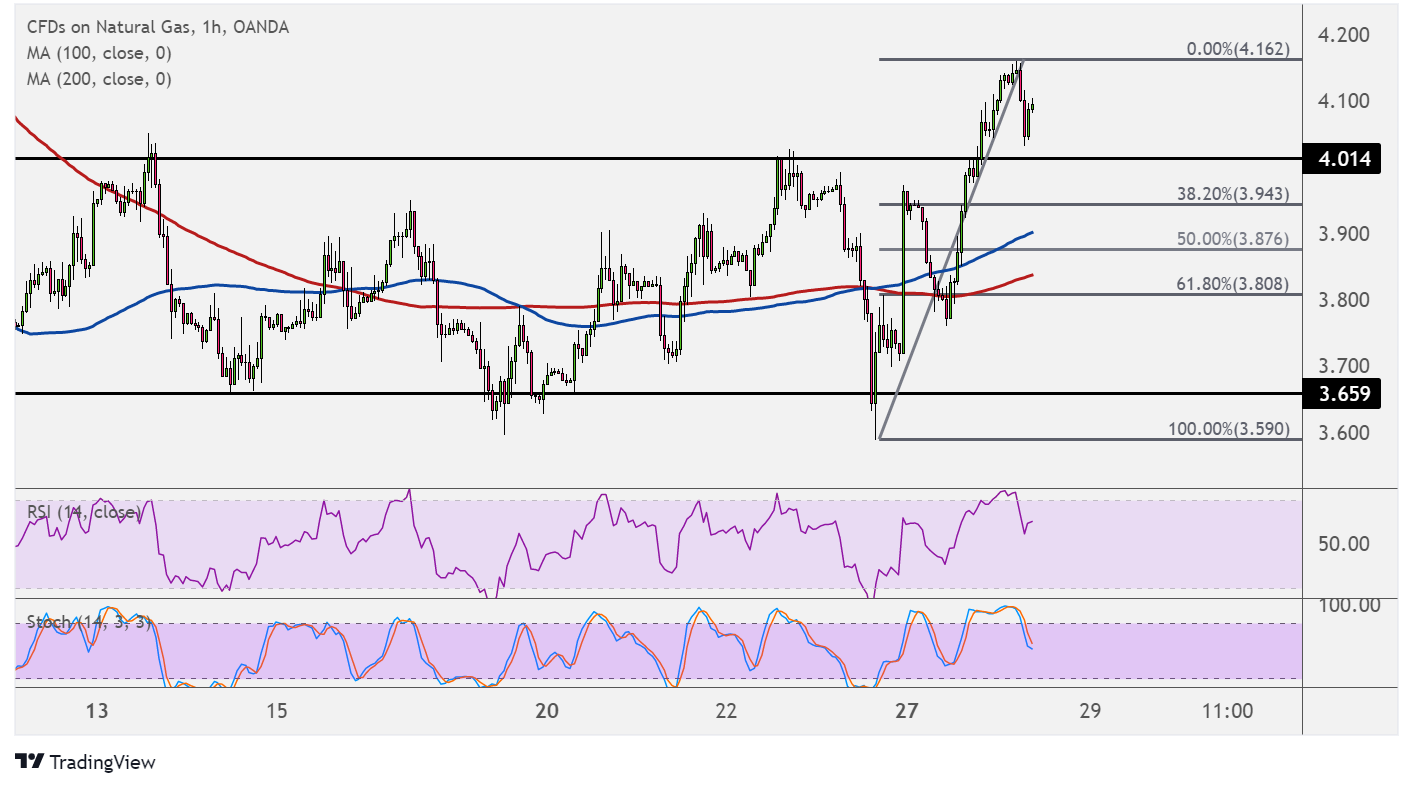
Natural gas broke above its range resistance around $4.000 to signal that a climb of the same height as the chart pattern is due. Price might still pull back to the nearby areas of interest to draw support.
The Fibonacci retracement tool shows that the 38.2% level is close to the broken range resistance around $3.943 while the 50% level is in line with the 100 SMA dynamic support. A larger correction could reach the 61.8% Fib at $3.808 near the 200 SMA.

The 100 SMA is above the 200 SMA to confirm that the path of least resistance is to the upside or that support is more likely to hold than to break. The gap between the indicators is widening to reflect strengthening bullish pressure.
RSI is on the move down to show that sellers are in control, and the oscillator has plenty of room to head south before reflecting oversold conditions. Stochastic is also heading lower, so price could follow suit while sellers have the upper hand.
Natural gas is starting its seasonal uptrend, as demand typically surges around this time of the year until early next year. Cooler temperatures are setting in and lifting purchases of heating commodities, and forecasts of even colder weather could keep demand elevated.
The earlier inventory report revealed a drop of 55 Bcf in stockpiles, in line with estimates and indicative of a slightly slower pickup in purchases. An even larger draw this time might mean more upside for natural gas prices since it would confirm that demand is starting to advance.
Note that stockpiles might also be depleted due to export activity to other countries that are undergoing colder weather while experiencing an energy crunch. Businesses might also be keen on stockpiling before prices head any higher later on.