
Natural gas has been selling off in the past weeks, but price might find support at nearby long-term areas of interest visible on the weekly chart.
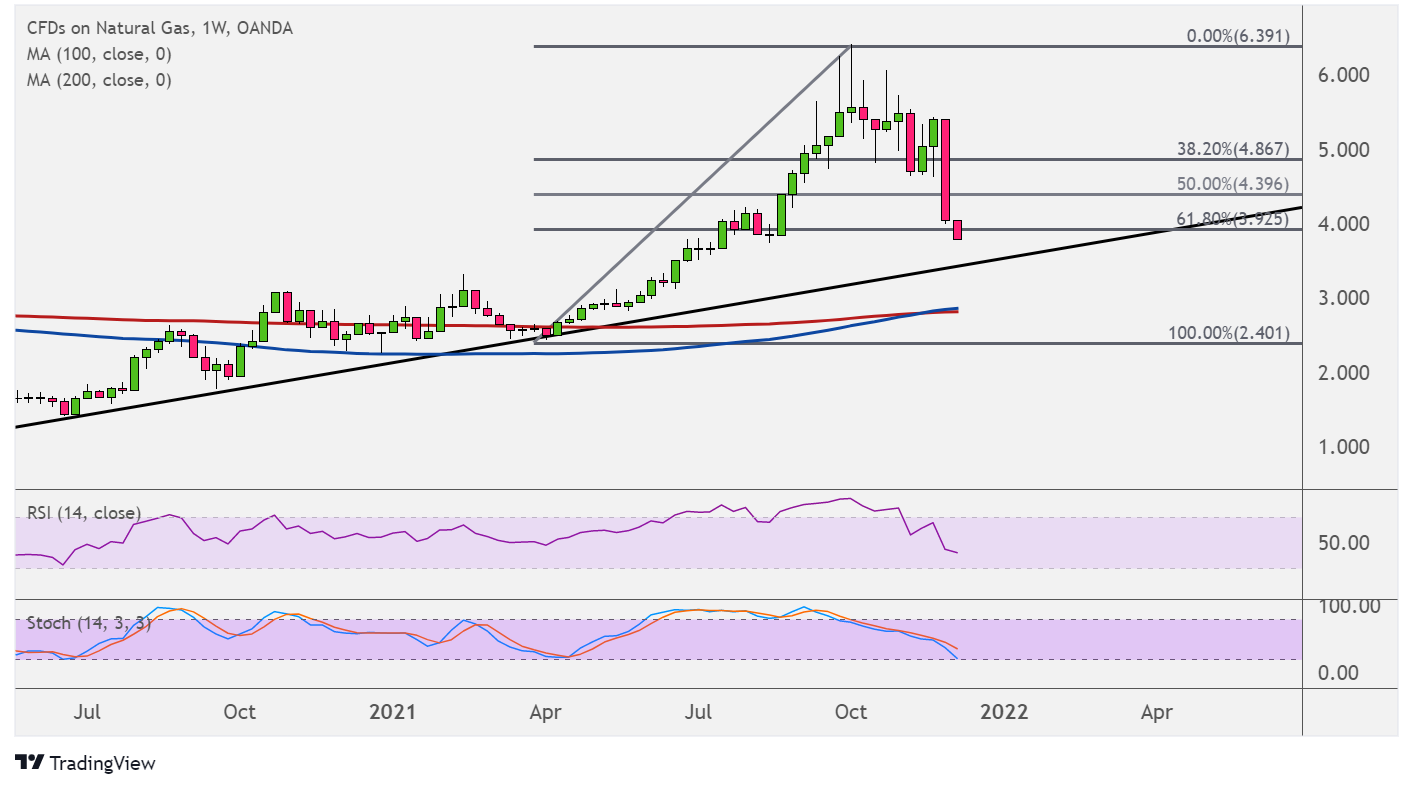
Price is testing the 61.8% Fibonacci retracement level around $4.000 and might also find buyers at the rising trend line support. Technical indicators are suggesting a return in bullish pressure soon.

The 100 SMA is crossing above the 200 SMA to indicate that the path of least resistance is to the upside or that support is more likely to hold than to break. These moving averages are just below the trend line support around $3.000 per barrel.
RSI has some room to head lower, which means that price could follow suit until oversold conditions are met. Similarly stochastic is moving south to show that sellers have the upper hand for the time being. Buyers could return once both oscillators reach the oversold region and turn higher.
If support holds, natural gas could resume the rally to the swing high around $6.390 or until the nearby resistance levels around $5.000.
Natural gas has been under weak footing owing to lower US domestic demand and a return in risk aversion. Lower temperatures across the US are weighing on purchases of the cooling commodity, and it might take weeks before winter spurs stronger demand for heating commodities.
Meanwhile, risk appetite has taken a hit due to the emergence of the Omicron variant, prompting investors to worry about another round of lockdowns and challenges to global growth. This has weighed heavily on riskier and higher-yielding assets like commodities, including natural gas.
The upcoming inventory report from the Department of Energy should provide directional clues in the near-term, determining whether or not support levels are likely to hold. A build in stockpiles would confirm the slump in demand, possibly dragging natural gas prices much lower.