
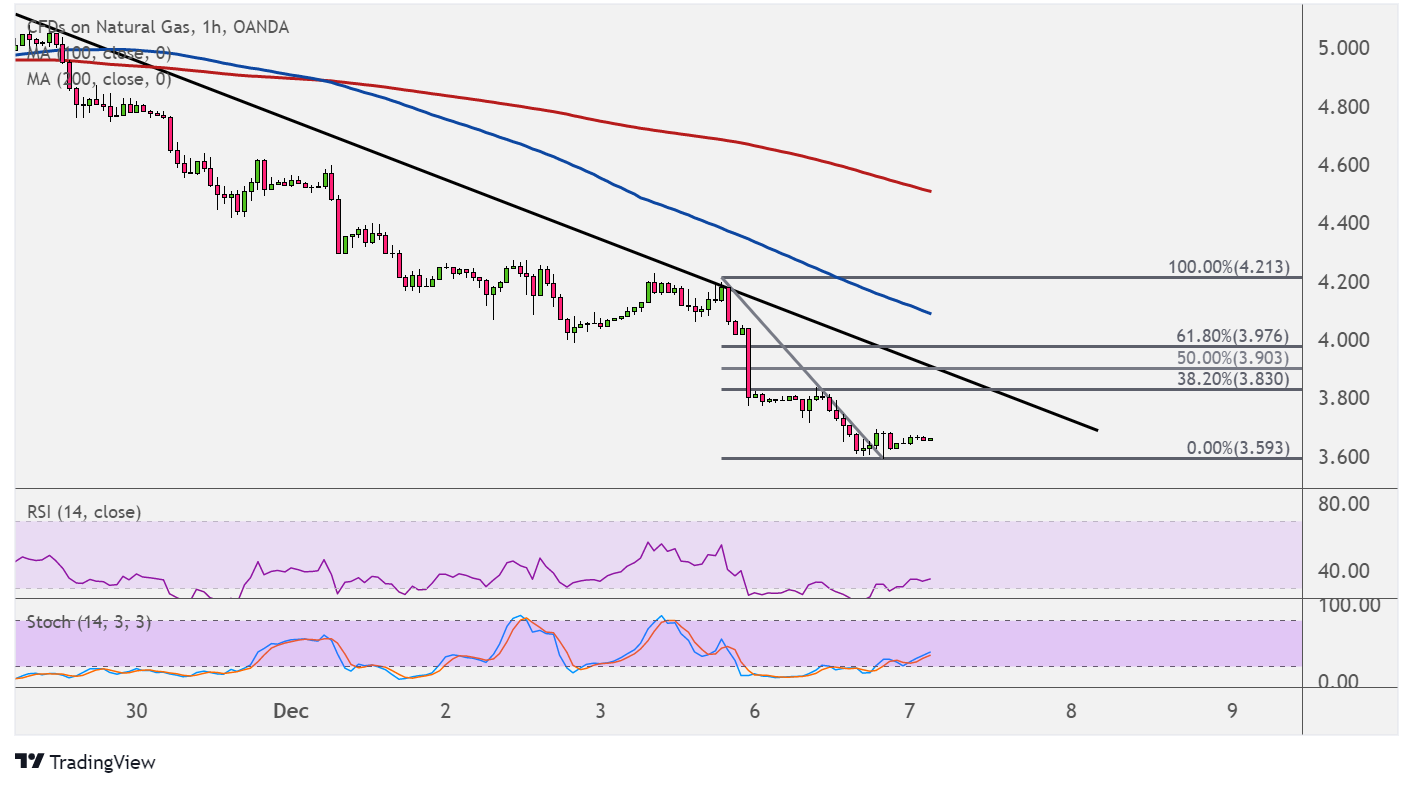
Natural gas formed lower highs connected by a short-term falling trend line. A pullback to this resistance area could follow soon, as price is finding some support around $3.600.
Applying the Fibonacci retracement tool shows where more sellers might be waiting to hop in. The 38.2% Fib lines up with a short-term area of interest around $3.830 while the 50% Fib is closer to the trend line at $3.900. The 61.8% level is near the $4.000 major psychological mark, which might be the line in the sand for a correction.

The 100 SMA is below the 200 SMA to indicate that the path of least resistance is to the downside or that the downtrend is more likely to resume than to reverse. The gap between the indicators is widening to reflect strengthening selling pressure.
RSI is pulling higher from the oversold region to signal a return in bullish momentum, and the oscillator has plenty of room to climb before reflecting exhaustion among buyers. Stochastic is also moving north, so price could follow suit while buyers have the upper hand.
Natural gas is still on weak footing, as weather forecasts suggest a balmy start to the winter season. This could mean weaker demand for heating commodities than before. Purchases of natural gas are already feeble these days due to dropping temperatures weighing on demand for cooling commodities.
Note that risk aversion remains in play due to the detection of the Omicron variant, possibly leading businesses and consumers to be more cautious. This could mean a significant setback to the ongoing rebound in spending activity, with vaccination efforts showing some success.
A return in risk-taking, along with a draw in inventories, could be bullish for the commodity. On the other hand, a large build in stockpiles as reported by the Department of Energy could lead to a fresh set of losses.