
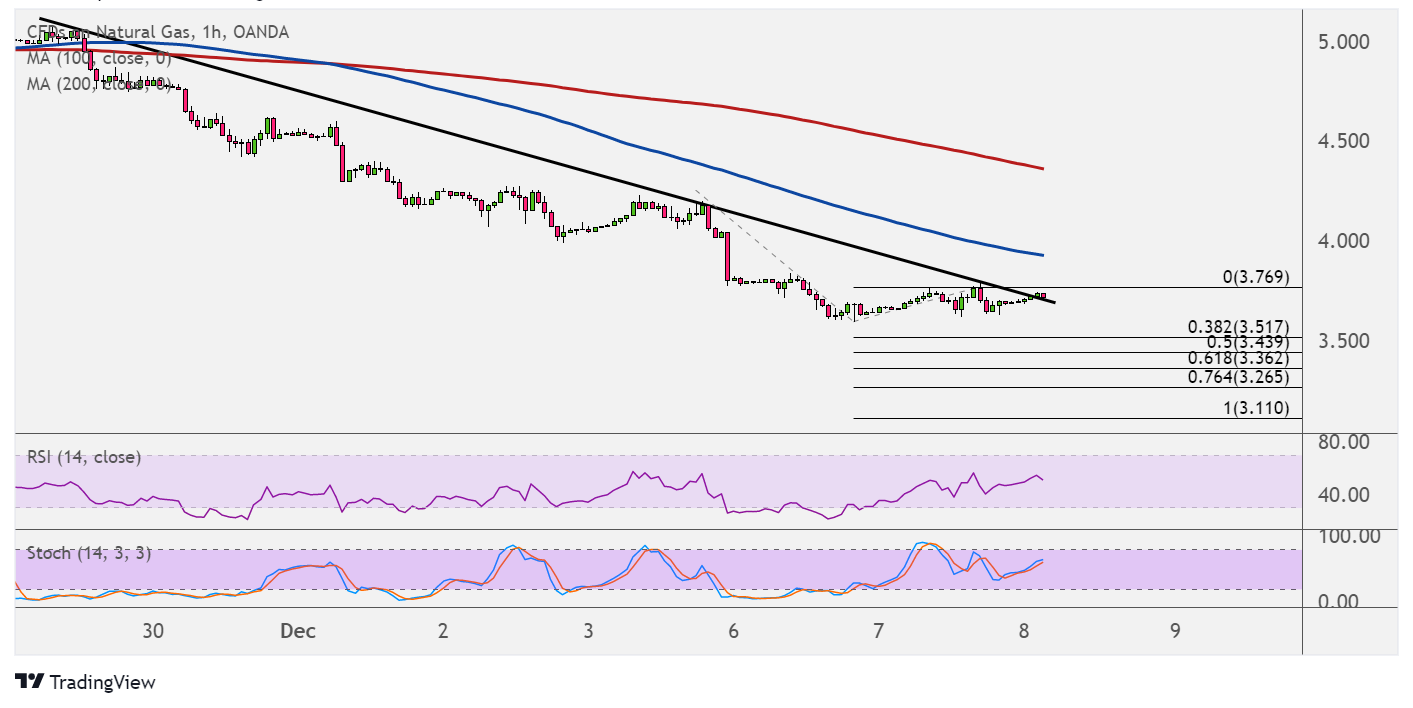
Natural gas continues to trend lower as it found resistance on the short-term falling trend line visible on the hourly chart. Price could be in for a selloff to the next downside targets from here.
The Fibonacci extension tool shows that levels that sellers might be aiming for. The 38.2% Fib is at $3.517 then the 50% level is at $3.439. Stronger selling pressure could take natural gas down to the 61.8% extension at $3.362 or the 76.4% level at $3.265. The full extension is at $3.110.

The 100 SMA is below the 200 SMA to indicate that the path of least resistance is to the downside or that the selloff is more likely to gain traction than to reverse. The gap between the indicators is widening to reflect strengthening selling pressure.
However, RSI has some room to head higher before reaching the overbought zone, suggesting that buyers might still have some energy left. Stochastic is also pointing up to signal the presence of bullish momentum, but the oscillator is approaching the overbought area.
Natural gas remains under weak footing, as the winter season seems off to a warmer than usual start. To top it off, the output crunch seems to have eased, assuring that there would be enough supplies for later in the year when temperatures drop even lower.
Risk-off flows stemming from the Omicron variant are still in play as well, weighing on higher-yielding assets like commodities. Traders remain wary that travel restrictions and lockdown measures might be imposed, likely putting another dent to business and consumer activity.
The Department of Energy is projected to show a drop of 60 Bcf in stockpiles, slightly higher than the earlier reduction of 59 Bcf to suggest a pickup in demand or a dip in output. A larger than expected draw might mean strong upside for the commodity.