
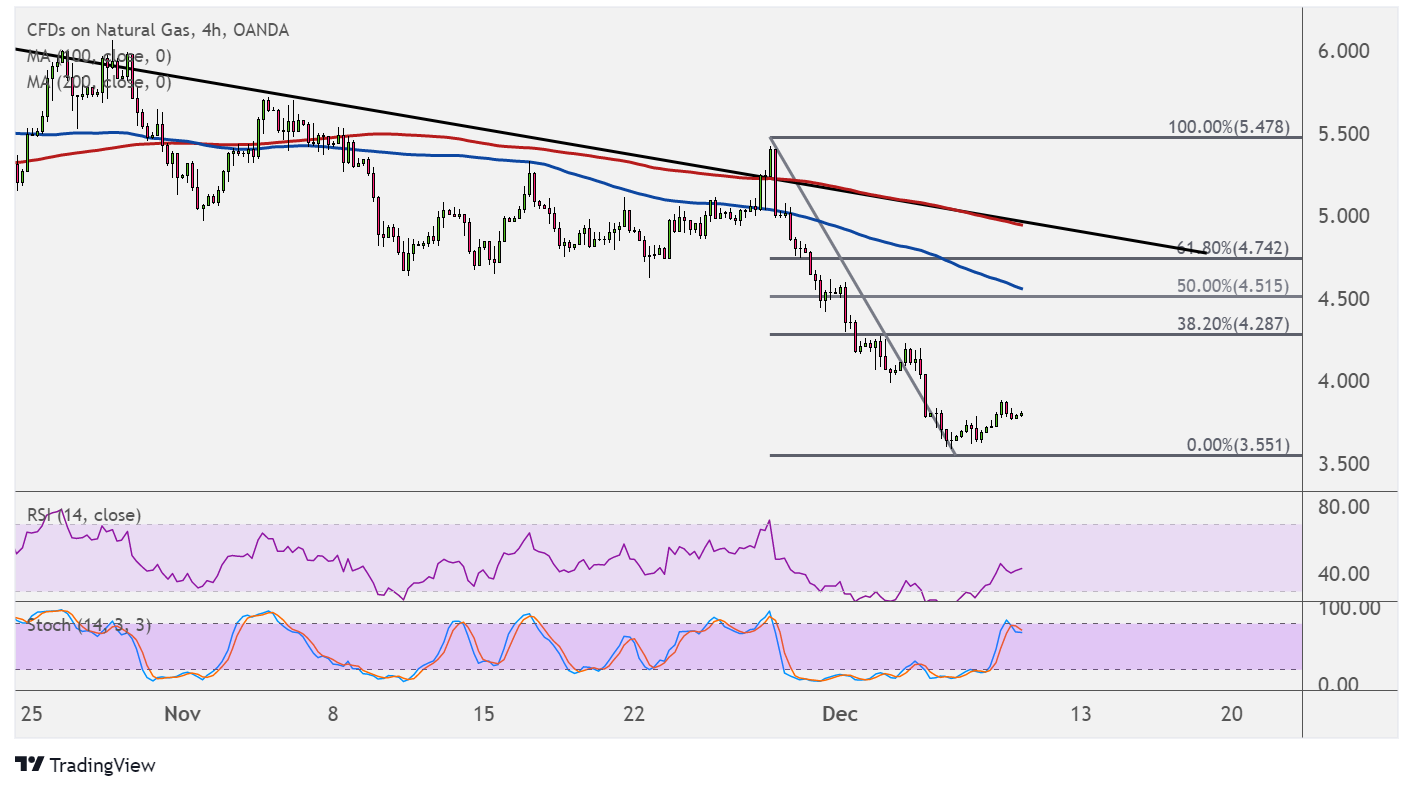
Natural gas looks prime for a large correction, as price is pulling up from the lows around $3.550 after its latest slide. Applying the Fibonacci retracement tool shows where more sellers might be waiting.
The 38.2% level is at $4.287, then the 50% Fib is at $4.515 in line with the 100 SMA. The 61.8% level lines up with a descending trend line that’s been holding since last month, along with the 200 SMA dynamic resistance, so bearish pressure could be stronger there.

The 100 SMA is below the 200 SMA to indicate that the path of least resistance is to the downside or that the selloff is more likely to resume than to reverse. The gap between the indicators is widening to reflect strengthening selling pressure as well.
RSI is still pulling higher after recently reaching the oversold region, suggesting that buyers are taking over while sellers take a break. The oscillator has plenty of room to climb before reflecting overbought conditions, so the correction could keep going until it does.
Stochastic is already starting to turn lower from the overbought zone to indicate that buyers are exhausted and that sellers might be taking over. If any of the Fibs hold, natural gas could slide back to the swing low or lower.
The upcoming inventory report by the Department of Energy could show a draw of 60 Bcf in stockpiles, following the earlier 59 Bcf reduction. A larger than expected draw might mean more upside for the commodity while a small reduction or a surprise build could spur another leg lower.
Note that domestic demand is sliding on account of weaker demand for cooling commodities while temperatures are dropping. However, purchases might be due to pick up as winter season is drawing close, likely leading to stronger demand for heating commodities.
Forecasts of warmer than usual weather up ahead, though, are weighing on natural gas prices.