
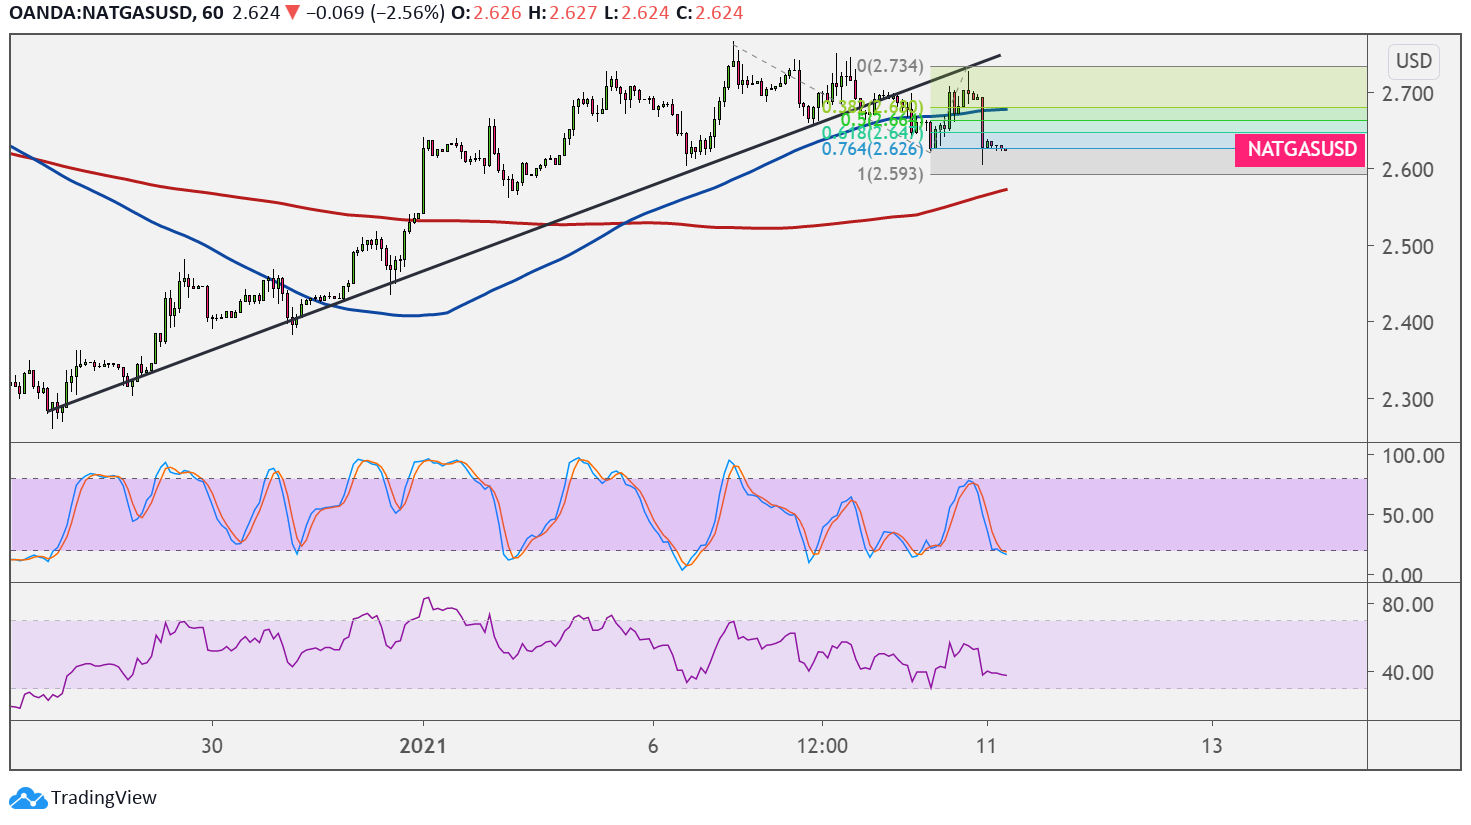
Natural gas fell below its rising trend line on the short-term chart and has since completed a pullback. Price appears to be aiming for the next downside targets from here.
Applying the Fibonacci extension tool shows where sellers are likely to book profits. Price is testing the 76.4% extension but might still have enough bearish momentum to dip to the full extension slightly below the $2.600 mark.

The 100 SMA is above the 200 SMA, though, so the path of least resistance is to the upside. In other words, there’s still a chance for a climb to resume. Price has dipped below the 100 SMA dynamic inflection point as an early indicator of bearish pressure. The 200 SMA is near the full extension, possibly adding to its strength as support.
Stochastic is moving down to show that sellers have the upper hand, but the oscillator is also nearing the oversold region to signal exhaustion. Turning higher would suggest that buyers are taking over and ready to allow the uptrend to resume. RSI has more room to head south before indicating oversold conditions.
Natural gas is under downside pressure as the number of rigs drilling natural gas in the US rose by 1 at 84 rigs for the week to January 8 according to the weekly Baker Hughes report. This could mean increased supply in the coming months, which might then keep price gains in check.
Then again, cooling weather conditions could shore up demand for the heating commodity, especially if weather forecasts suggest milder temperatures all over the US. The inventory report from the Department of Energy could contain more insights on supply and demand conditions, as another larger than expected draw in stockpiles might bring in more gains for natural gas prices. A surprise build, on the other hand, could mean losses.