
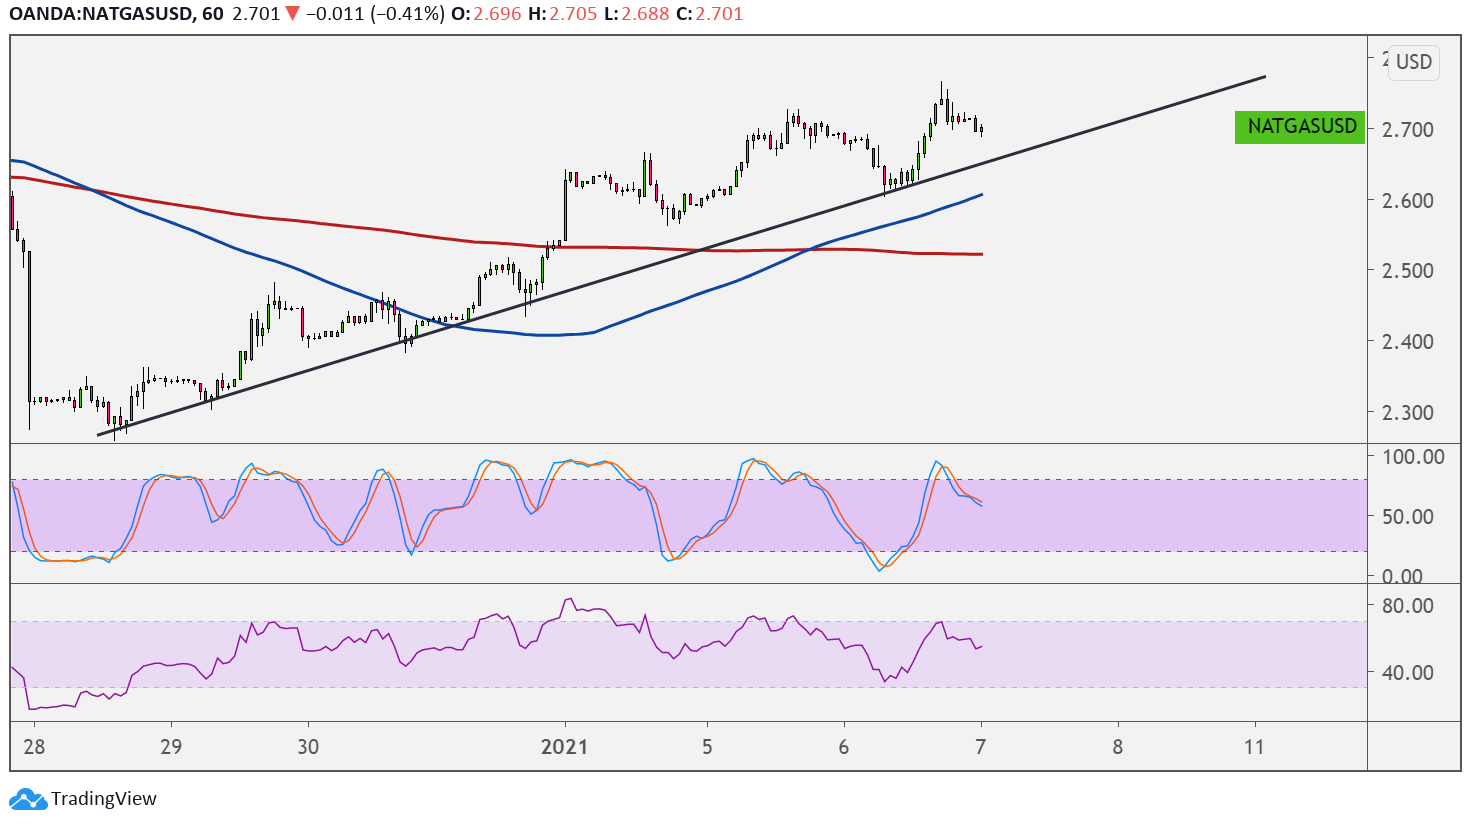
Natural gas has formed higher lows connected by a rising trend line that’s been holding since late last year. Price looks due for a pullback to this support area next.
Technical indicators are giving mixed signals as to whether the trend is likely to resume or not. The 100 SMA is above the 200 SMA to indicate that the path of least resistance is to the upside or that support is more likely to hold than to break. Price is also trading above both moving averages, so these could hold as dynamic support on dips.

Stochastic pointing down from the overbought zone to signal that sellers are taking over while buyers are taking a break. The oscillator has plenty of room to move south before indicating oversold conditions or exhaustion among sellers. RSI is also heading south to reflect the presence of bearish momentum.
Support at the trend line around $2.700 or the moving averages could hold once the oscillators reach the oversold region and turn higher.
Natural gas prices are enjoying strong support ahead of the release of the US inventory report, which is slated to show a draw of 110 Bcf. A larger than expected reduction would confirm that demand is supported while weather conditions are cooling, bringing in stronger purchases of heating commodities.
A surprise build, on the other hand, could mean that demand is feeble while supply remains elevated. Keep in mind that restrictions are still weighing on business and consumer activity while the pandemic is a huge concern.
However, the possibility of more stimulus from the US government, as well as the vaccine rollout, are lifting risk appetite and shoring up demand for higher-yielding assets like commodities. If this keeps up, natural gas could enjoy more upside in the near-term, barring any major dents to risk-taking.