
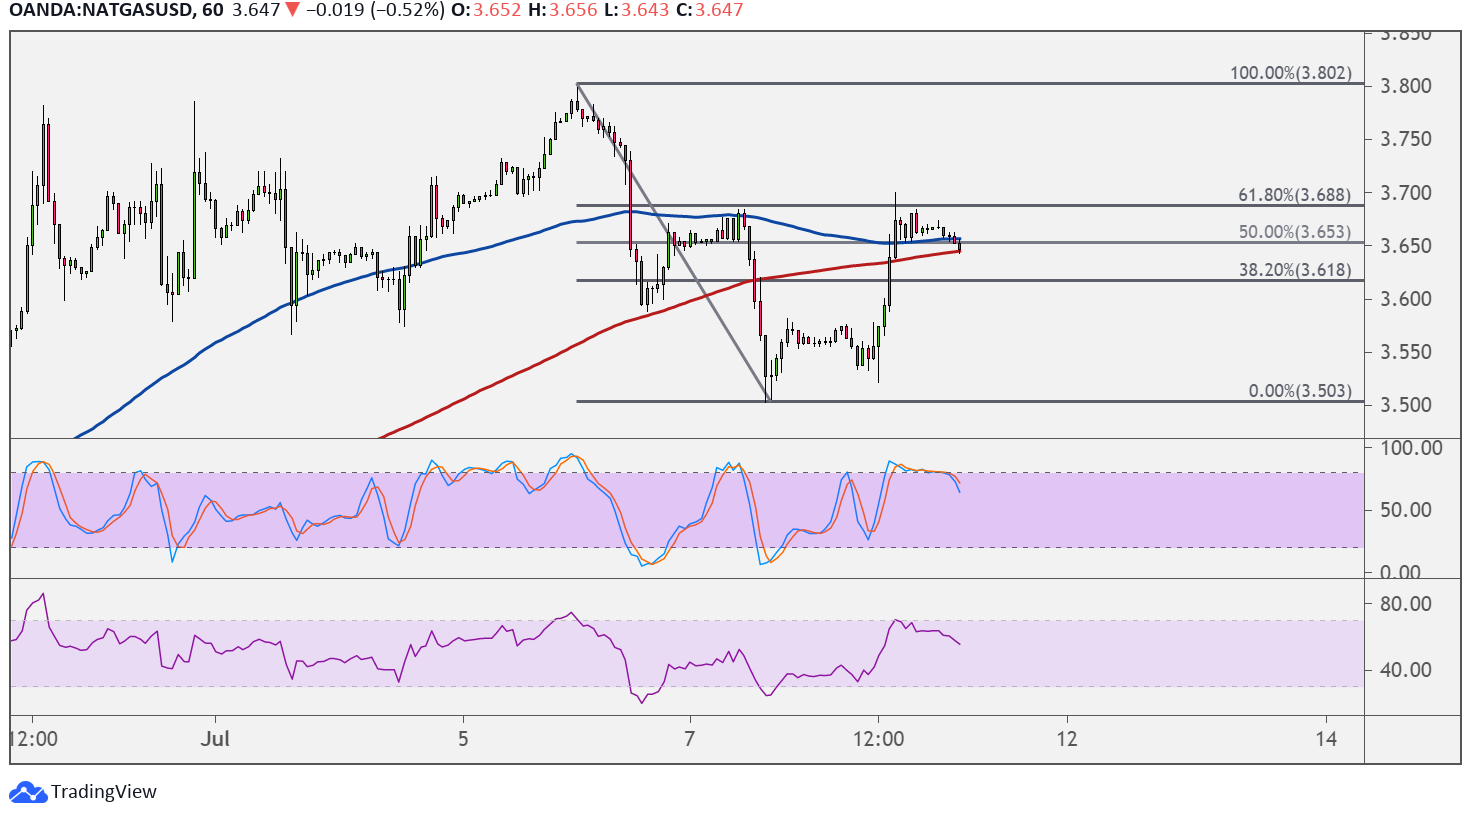
Natural gas recently fell through support at the $3.600 handle and is pulling up for a retest of the area of interest. This lines up with the Fibonacci retracement levels, with the 61.8% Fib being tested as resistance.
If it holds, natural gas could slump back to the lows near $3.500 or lower. The 100 SMA is above the 200 SMA for now to reflect bullish pressure, but the gap between the two has narrowed enough to signal an incoming bearish crossover.

Natural gas is trading above both moving averages as an indication of bullish pressure, but falling back below it could confirm that sellers are in control.
Stochastic is also turning lower from the overbought zone to signal a pickup in selling pressure. RSI is also heading south to show that bears are taking over, and both oscillators have plenty of room to go before indicating oversold conditions.
Natural gas could continue to enjoy upside pressure, as the Department of Energy reported a smaller build of 16 Bcf versus the estimated gain of 29 Bcf and the earlier increase of 76 Bcf. This suggests that demand continues to advance as higher temperatures are observed all over the US during these summer months.
The commodity also seems to be shrugging off its losses after the FOMC minutes revealed that more policymakers are leaning towards tapering monetary policy sooner rather than later. This led investors to project higher borrowing costs possibly by the end of the year, which might then limit demand for riskier assets like natural gas.
Any major swings in sentiment up ahead could continue to impact natural gas prices, as a return in risk-on flows might mean strong gains for the commodity. Forecasts of warmer weather up ahead could bring more upside for natural gas prices.