
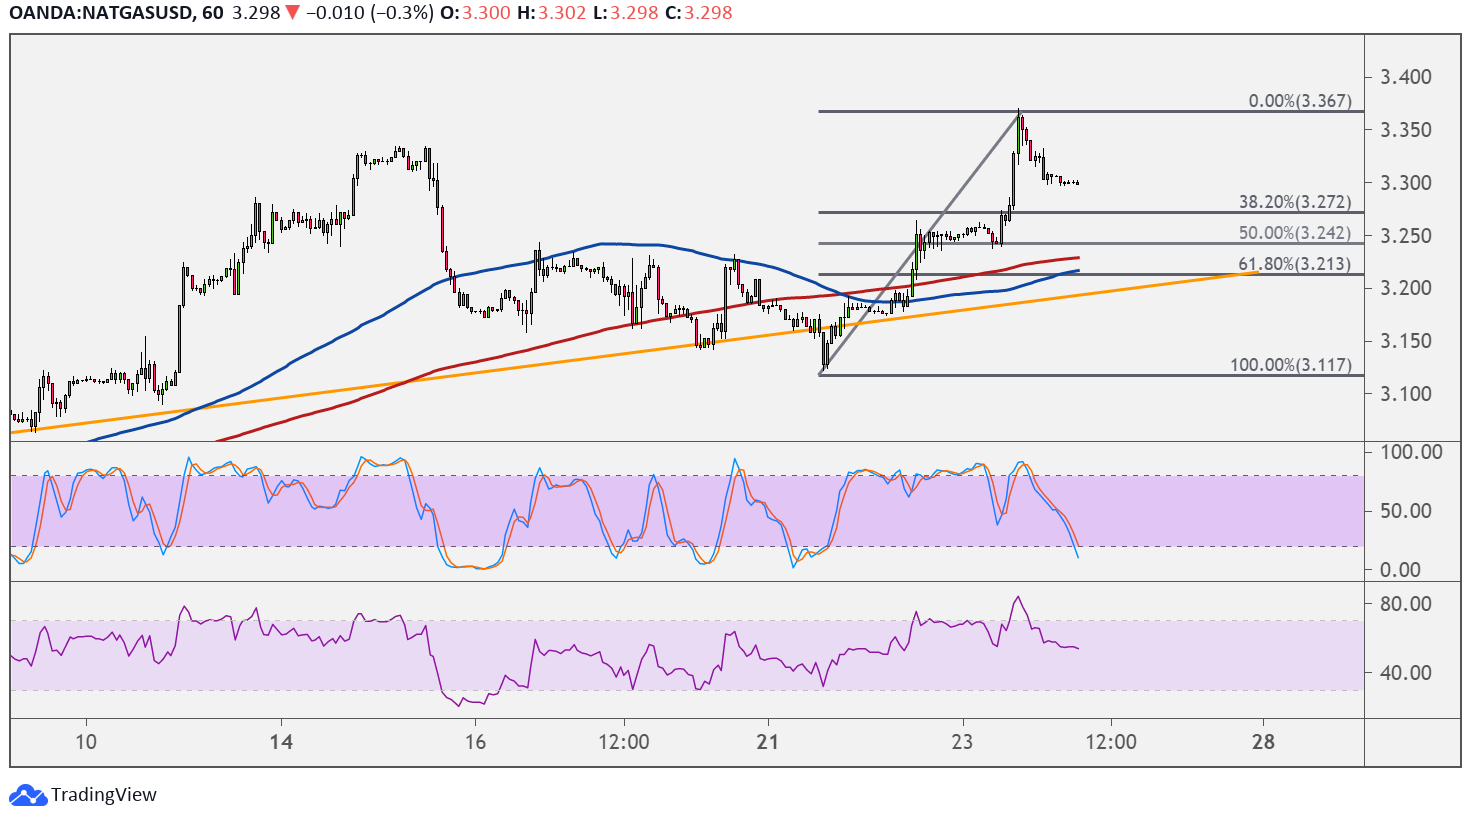
Natural gas surged higher in the past 24 hours but is in the middle of another short-term pullback. Price could retreat to the support levels marked by the Fibonacci retracement tool.
The 61.8% Fib lines up with a new rising trend line visible on the 1-hour time frame. This is also in line with the dynamic support around the moving averages at $3.213.

On the subject of moving averages, the 100 SMA is above the 200 SMA to suggest that the path of least resistance is to the downside or that support is more likely to break than to hold. A move below the $3.200 mark could be enough to signal that a reversal is in the works.
RSI has more room to move south before reaching the oversold area, so sellers could stay in control for much longer.
However, stochastic is already dipping into the oversold region to signal exhaustion among sellers, so turning higher would mean that buyers are taking over. The 38.2% Fib is close by at $3.272 then the 50% level is at $3.242. If any of these Fibs hold as a floor, natural gas could recover to the swing high at $3.367 or higher.
A larger build in natural gas storage is eyed for the latest reporting week, with the Department of Energy likely printing a gain of 64 Bcf versus the earlier increase of 16 Bcf. This might suggest that demand has faded or that supply has picked up to meet seasonal purchases.
Keep in mind that higher temperatures also tend to spur stronger demand for the cooling commodity, so forecasts of warmer weather in the coming weeks might still be enough to keep natural gas prices supported.
A smaller than expected build or a surprise draw might even mean a shallow retracement for the commodity and a quick rally past the swing high.