
Natural gas appears to be forming a double top chart pattern on the short-term time frame, signaling that a reversal from the earlier uptrend could be in the works.
The two peaks were carved out near the $3.200 area, and price is now pulling back to test the neckline support around the $3.000–$3.050 area of interest, where a shaded horizontal zone on the chart also lines up.

A confirmed break below this neckline would complete the double top and open the door to a measured move selloff of roughly the same height as the formation. This puts the downside target somewhere in the $2.800 region, which also lines up with the 200 SMA dynamic support level.
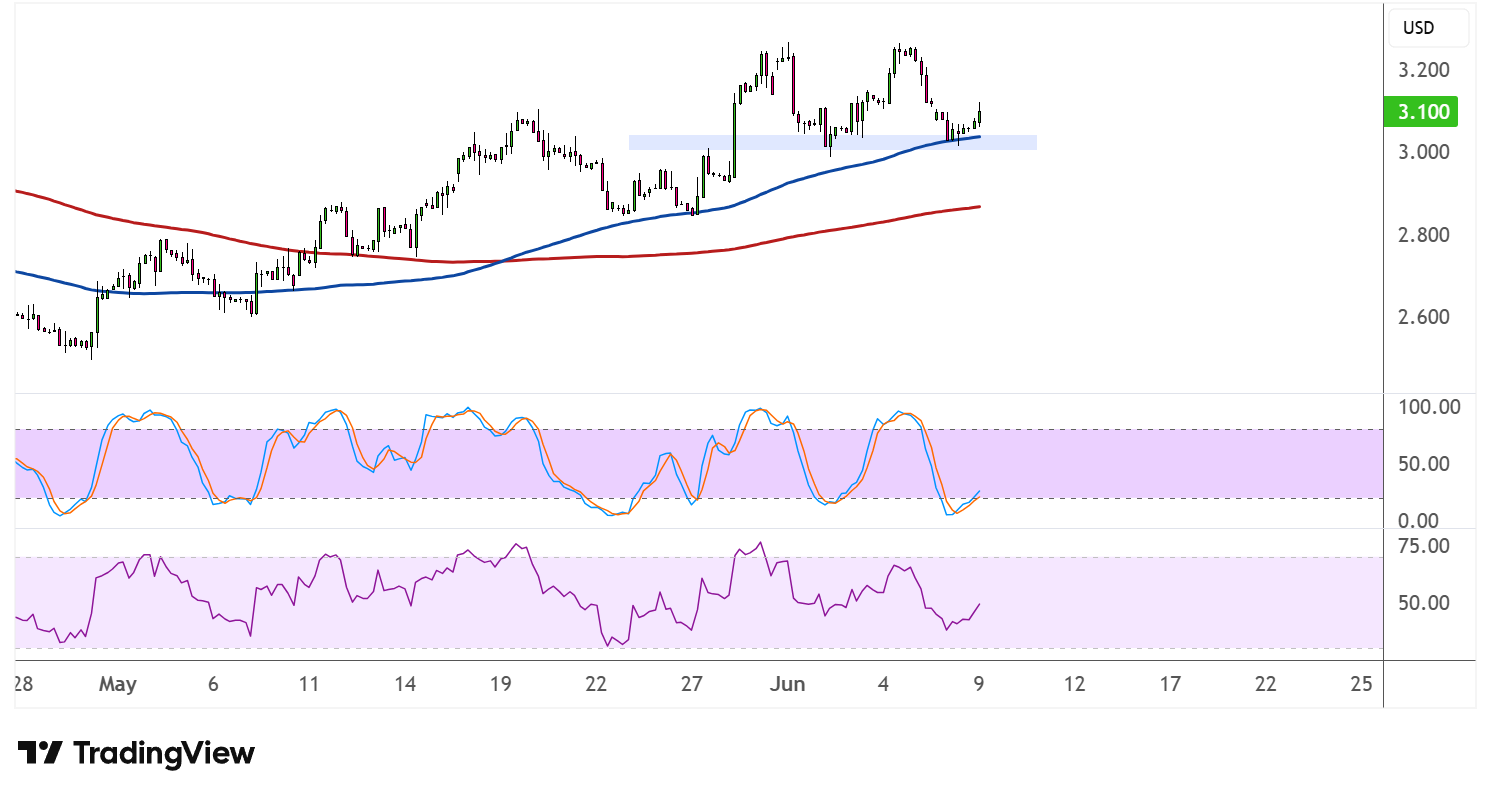
The 100 SMA has crossed above the 200 SMA, which typically confirms that the path of least resistance remains to the upside. However, the gap between the two indicators appears to be narrowing, hinting that bullish momentum may be starting to fade. Price has already slipped back below the 100 SMA, which could now flip to act as dynamic resistance on any attempted recovery.
Stochastic has tumbled from the overbought region and is now nearing the oversold zone, suggesting that sellers have been in control of the recent leg lower. If the oscillator turns up from oversold levels, a brief bounce back to the neckline area could take place before the downtrend resumes.
RSI is hovering around the midpoint and still has room to slide toward oversold territory, keeping the door open for further downside. A drop below the 50 level on the RSI would add further confirmation that bears are gaining the upper hand.
A daily close below the neckline and the $3.000 psychological level would likely seal the bearish case for natural gas. The commodity could take cues from inventory data, as a large build in stockpiles could point to weakening demand conditions as summer months approach.