
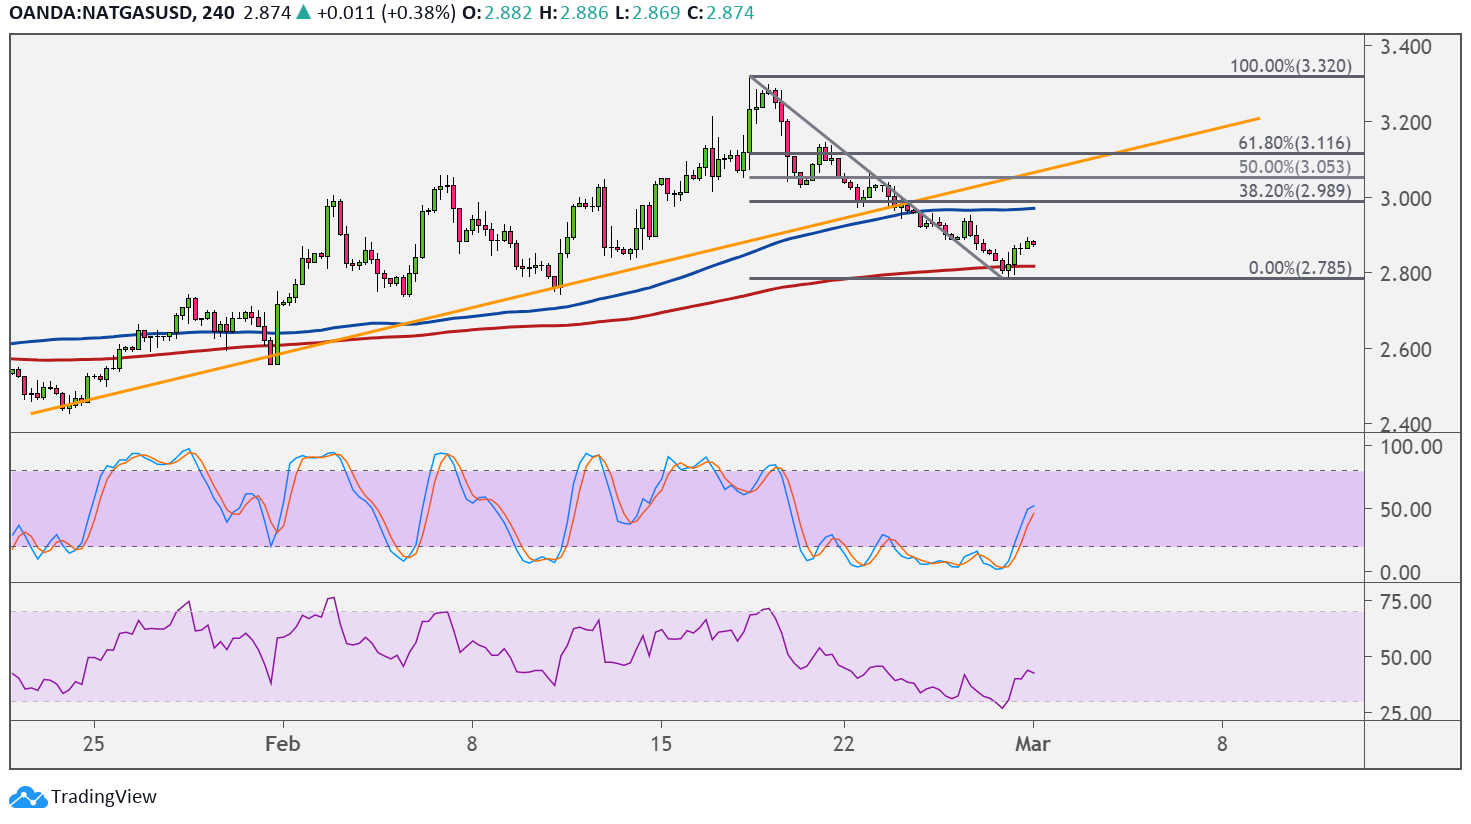
Natural gas recently fell through its rising trend line support to signal that a reversal from the uptrend is in the works. Price looks ready for a retest of the broken trend line before resuming the slide.
Applying the Fibonacci retracement tool shows where sellers are likely waiting. The 50% level lines up with the broken support around $3.053 while the 38.2% level is closer to the $3.000 major psychological mark and 100 SMA dynamic inflection point.

This moving average is above the longer-term 200 SMA, though, so the path of least resistance is to the upside. In other words, there’s still a chance for the climb to resume. The 200 SMA dynamic support appears to be keeping losses in check so far. The 61.8% Fib might be the line in the sand for a correction, as a break above this could signal that the uptrend is taking hold.
Stochastic is also on the move up to show that buyers are in control, and the oscillator has plenty of room to climb before reflecting overbought conditions or exhaustion among buyers. Similarly RSI is on the move up to show that there is bullish momentum returning.
Natural gas is on weaker footing despite the draw in stockpiles reported in the previous week. As it turns out, even though output has been crippled by the temporary shutdowns from the cold weather, demand has also taken a hit from producers’ inability to ship out the commodity in the past weeks.
The upcoming EIA report could determine whether or not the selloff could gain traction, as another draw might be reported. This time, supply and demand conditions likely resumed their normal state as temperatures are slightly warmer. Then again, this might have weighed on demand for heating commodities, putting downward pressure on purchases.