
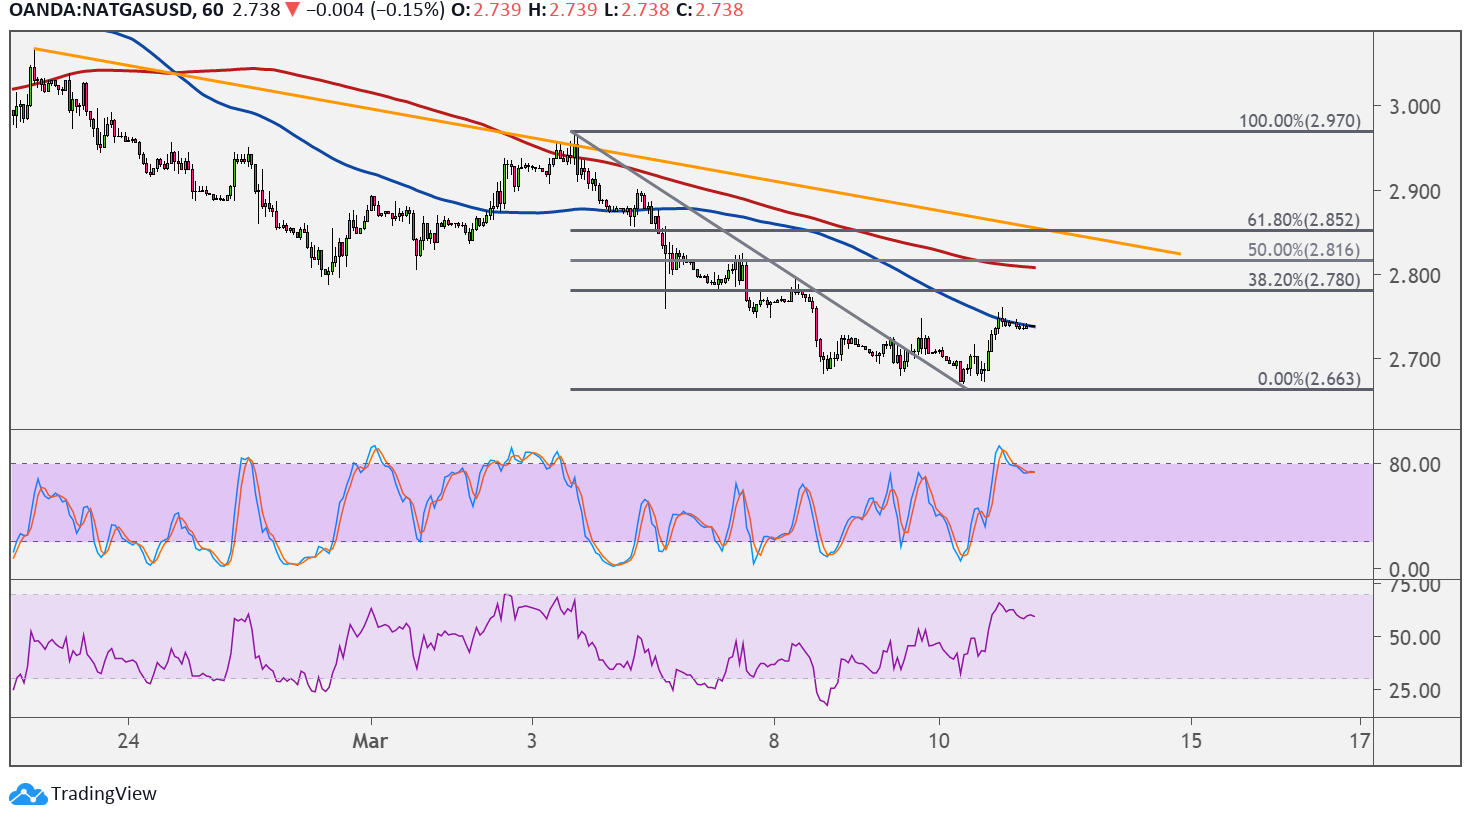
Natural gas is trending lower as a falling trend line can be drawn to connect the highs of price action since late March. Price is inching close to the nearest Fibonacci retracement level at $2.780.
A larger correction could last until the 50% level at $2.816 and near the 200 SMA dynamic resistance. The trend line is closer to the 61.8% Fib at $2.852, which might be the line in the sand for a pullback.

The 100 SMA is below the 200 SMA to indicate that the path of least resistance is to the downside or that the selloff is likely to carry on. The gap between the indicators is widening to reflect stronger selling pressure, and the 100 SMA is holding as dynamic resistance.
Stochastic is turning lower from the overbought zone to signal a return in selling pressure while buyers are taking a break. RSI is also turning lower without even reaching the overbought area, suggesting that bears are eager to return and take natural gas back to the swing low around $2.660 or lower.
The Department of Energy is slated to report a smaller draw of 75 Bcf compared to the earlier reduction of 98 Bcf, reflecting weaker demand or a pickup in supply. Also note that output likely picked up in the past week as producers reopened following temporary shutdowns on account of the winter storms.
A larger than expected draw could be bullish for natural gas, though, as this would signal that purchases are increasing on account of cooler temperatures. Risk appetite stemming from the House approval of Biden’s stimulus plan might also be enough to keep commodities and other higher-yielding assets supported in the near-term.
On the other hand, a surprise build or smaller than expected reduction could be bearish for natural gas as it might signal slower purchases of the commodity.