
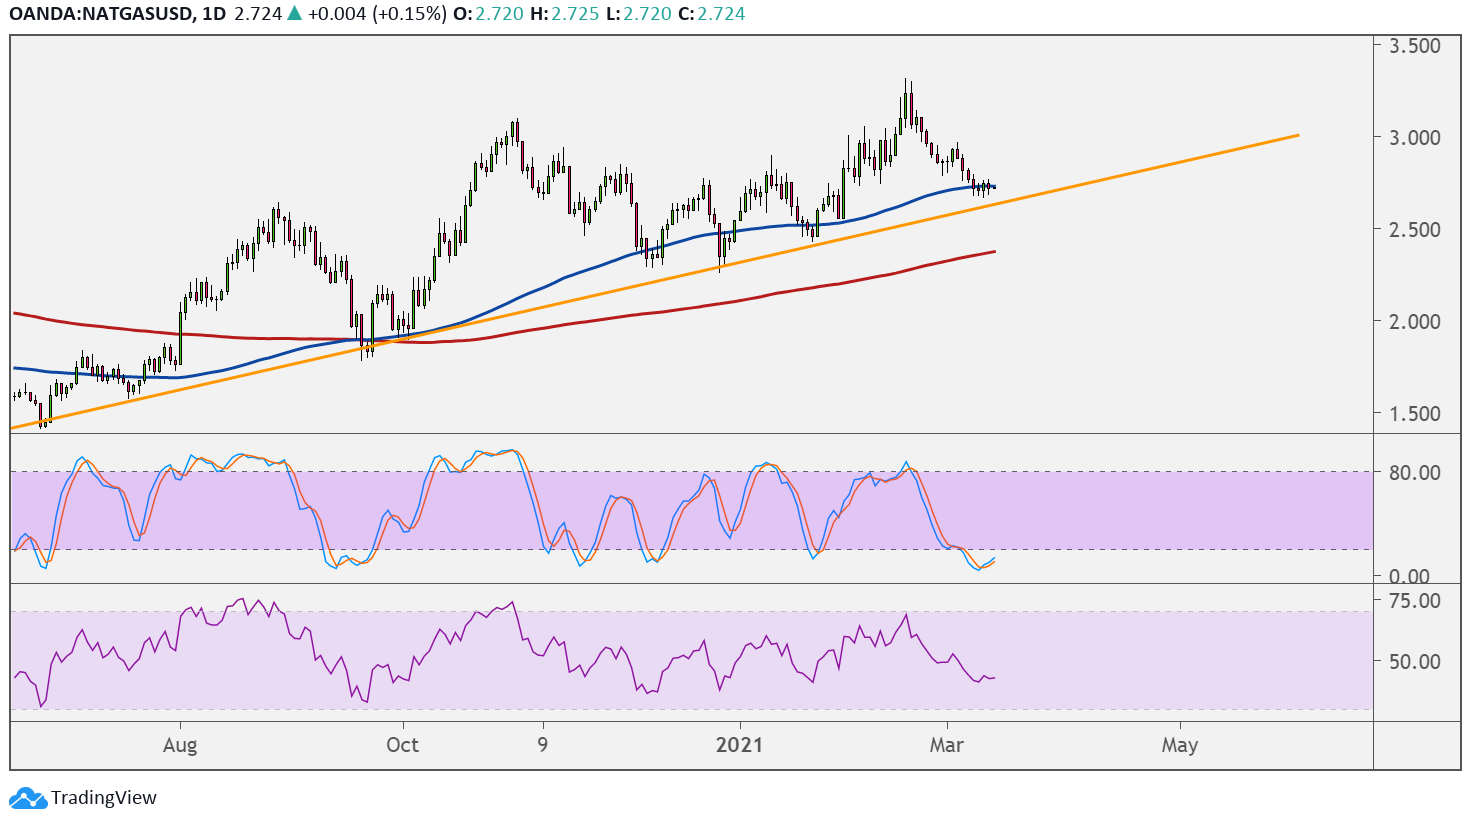
Natural gas is trending higher on the long-term time frames and looks ready to test the rising trend line on the daily chart. This lines up with an area of interest around $2.700 and the 100 SMA dynamic inflection point.
This faster-moving MA is above the longer-term 200 SMA to indicate that the path of least resistance is to the upside or that the climb is more likely to resume than to reverse. The gap between the indicators is wide enough to show that a bearish crossover isn’t likely to happen anytime soon.

Stochastic is also indicating exhaustion among sellers, and turning higher could mean a pickup in bullish momentum. The oscillator also made lower lows while price had higher lows, creating a bullish divergence.
RSI, on the other hand has room to head lower before reaching the oversold region to suggest that sellers could use a break. Turning higher could confirm a continuation of the climb.
Natural gas underwent some downside pressure on account of the inventory report, which showed a smaller than expected draw of 52 Bcf compared to the projected reduction of 76 Bcf and the earlier draw of 98 Bcf.
However, the commodity could carry on with its long-term climb as weather in the U.S. is expected to be cooler than normal over the next 6-10 days and then turning more moderate. This could mean that demand for heating commodities is to stay supported in the near-term before slowing down as warmer months set in.
The approval of Biden’s stimulus plan could also keep risk-taking in play, which is bullish for higher-yielding assets like commodities. After all, this could keep business and consumer activity supported in the months ahead. Also, vaccination efforts in developed nations could also be positive for risk appetite if these prove successful in warding off the virus.