
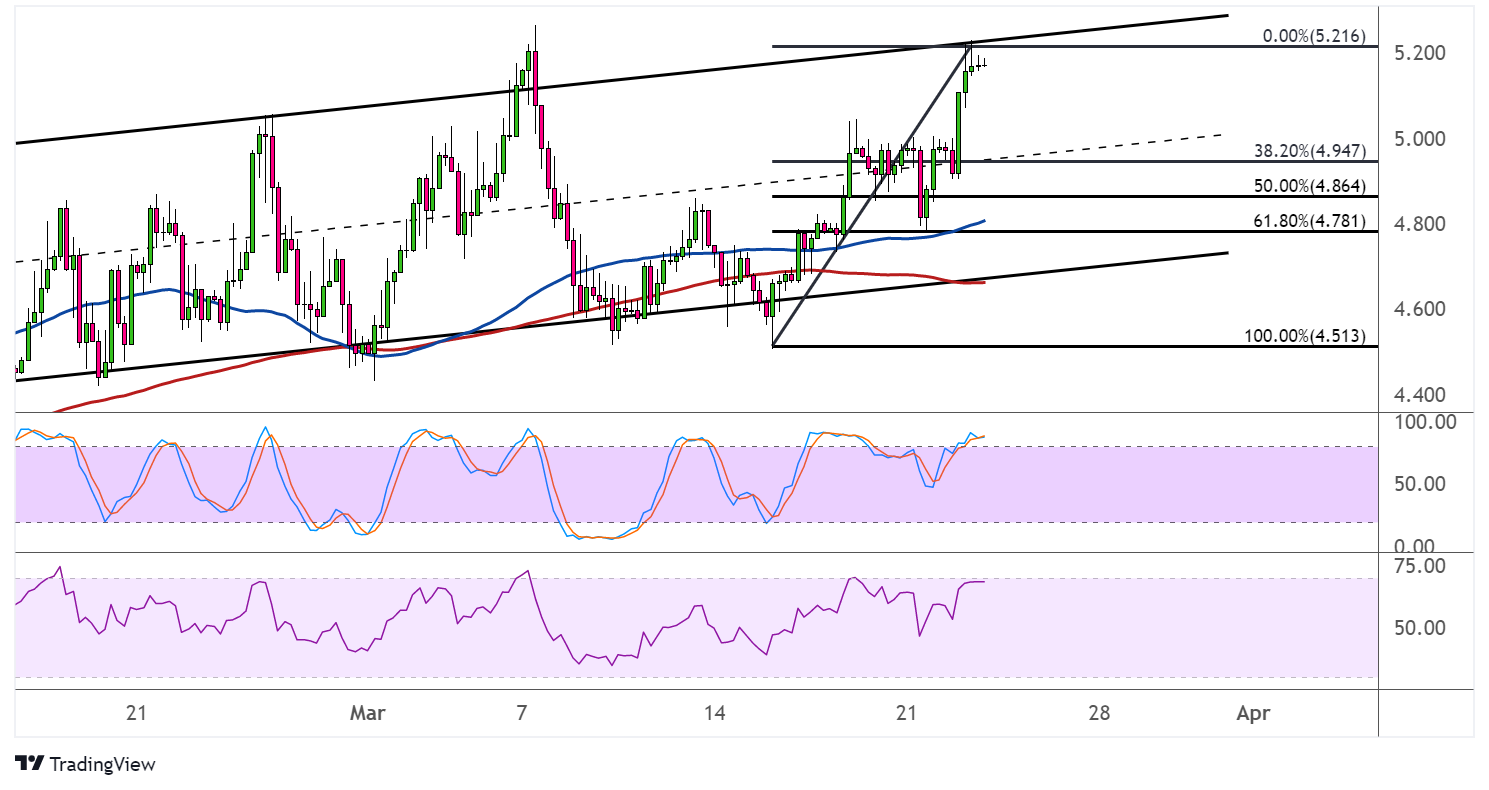
Natural gas is still trending higher inside its ascending channel on the hourly time frame and is testing the resistance. A pullback to nearby support levels might follow from here.
Applying the Fibonacci retracement tool shows where more buyers might be waiting to hop in. The 38.2% level is at the mid-channel area of interest around the $5.000 major psychological level. A larger correction could reach the 50% Fib at $4.864 or the 61.8% retracement level closer to the channel support.

This also happens to line up with the 100 SMA dynamic inflection point, which adds to its strength as support. The 100 SMA is above the 200 SMA to confirm that the path of least resistance is to the upside or that the uptrend is more likely to carry on than to reverse.
If any of the Fibs hold as support, natural gas could find its way back up to the swing high around $5.200 or higher.
However, stochastic is in the overbought zone to reflect exhaustion among buyers, so turning lower might suggest that sellers are returning. RSI is also nearing the overbought area to indicate that buyers need a break and allow bearish pressure to pick up soon.
Natural gas prices got another boost from worsening geopolitical tensions between Russia and Ukraine, prompting the EU to start joint purchases in order to meet the shortage. Temperatures remain low in some parts of Europe, keeping demand for heating commodities elevated.
In the US, some states are reporting warmer temperatures, which might lead to lower purchases of natural gas. This could be highlighted in the upcoming release of inventory data by the Department of Energy.
Analysts are expecting to see another smaller draw of 52 Bcf versus the earlier reduction of 79 Bcf, confirming the slowdown in purchases. An even lower reduction or a surprise build might mean some downside for the commodity.