
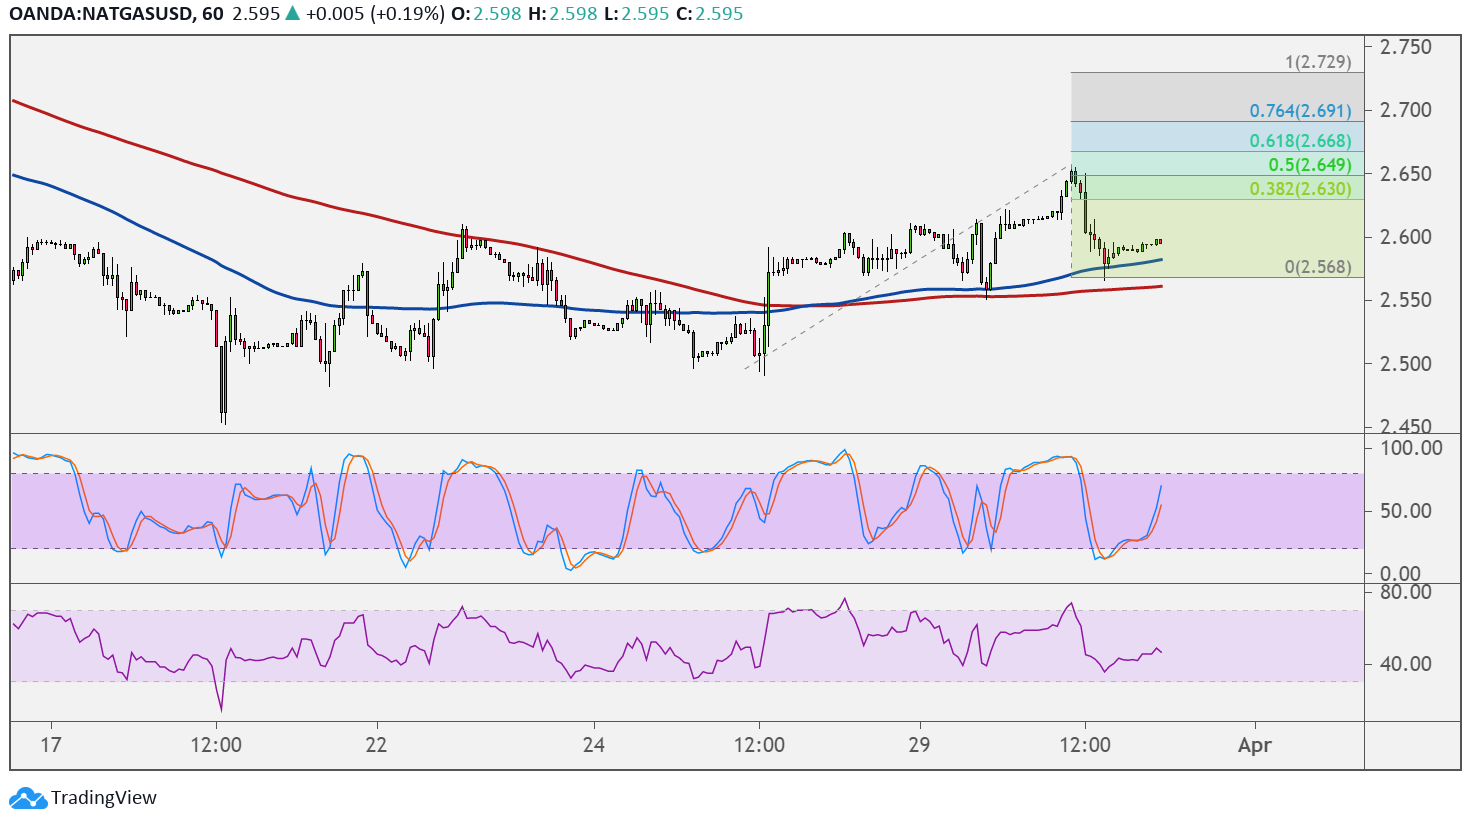
Natural gas appears to be finding support at the area of interest or former resistance turned support on its 1-hour chart. Price could make its way back up to the next upside targets marked by the Fibonacci extension tool from here.
The 38.2% level is at $2.630 then the 50% level is at $2.650 near the swing high. Sustained bullish pressure could take it up to the 61.8% level at $2.668 or the 76.4% level near the $2.700 mark. The full extension is at $2.729.

The 100 SMA is above the 200 SMA to confirm that the path of least resistance is to the upside or that support is more likely to hold than to break. These moving averages also line up with the area of interest to add to its strength as a floor.
Stochastic is on the move up to confirm that bullish pressure is present, and the oscillator has room to climb before reflecting exhaustion among buyers. RSI also appears to be bottoming out without reaching the oversold region, suggesting that buyers are eager to return.
Natural gas could find upside momentum if the inventory report from the Department of Energy shows another draw in stockpiles. This would reflect stronger demand as temperatures continue to stay low in several parts of the US.
Analysts are expecting to see a reduction of 20 Bcf versus the earlier draw of 36 Bcf, indicating slightly lower purchases or a possible pickup in production over the past week.
Profit-taking activity could be observed in the coming days as the month and quarter come to a close. Traders are also likely to close out positions ahead of the Holy Week holidays.
Apart from that, the NFP release might impact overall market sentiment and commodity price action by the end of the week, during which low liquidity could spur stronger volatility.