
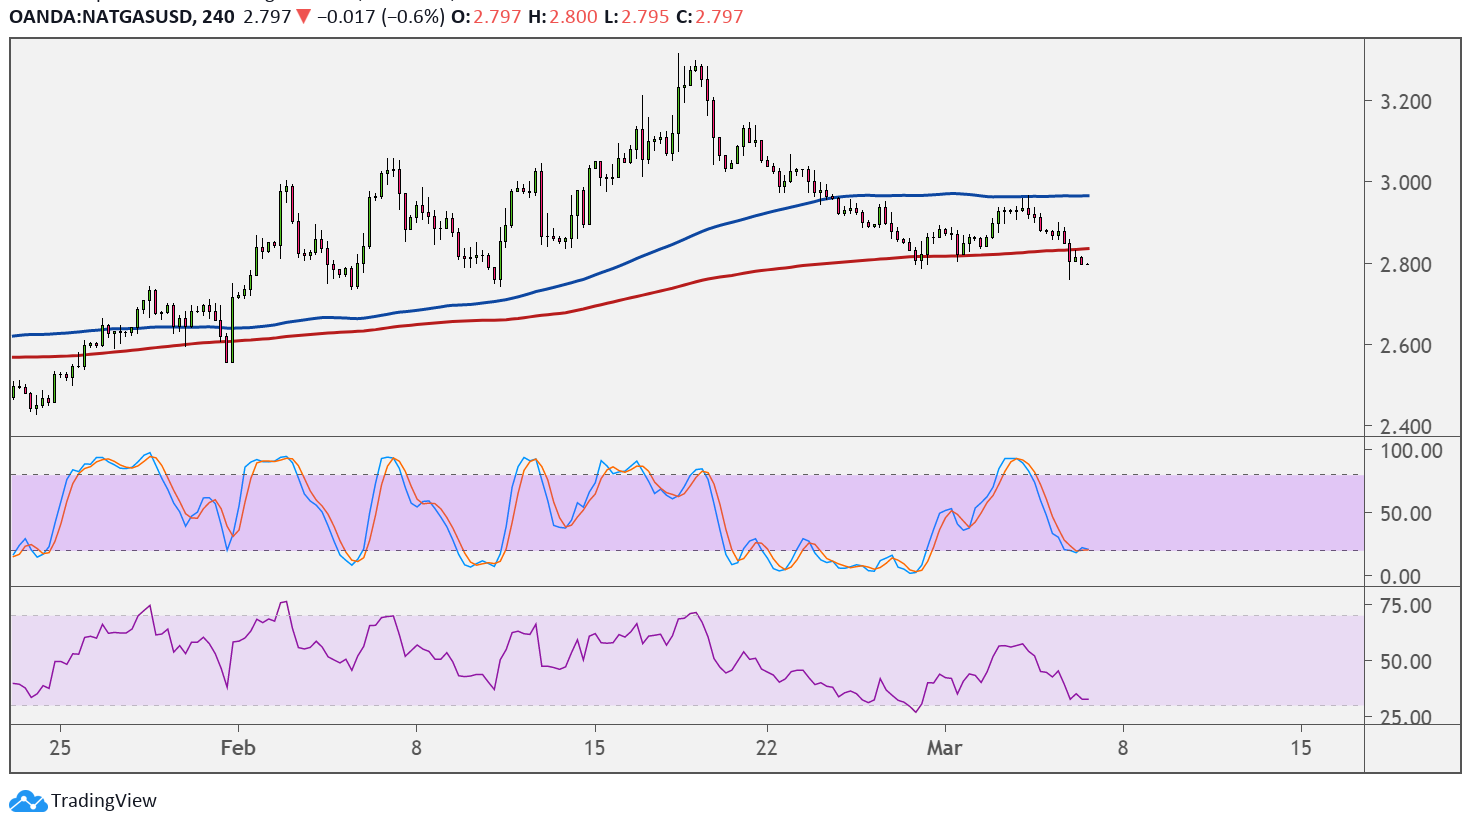
Natural gas could be in for a reversal from its climb as price is forming a head and shoulders pattern on its 4-hour time frame. Price has yet to break below the neckline support to confirm that a selloff is in the works.
If that happens, natural gas could slide by roughly the same height as the reversal formation, which spans $2.800 to $3.100.

However, the 100 SMA is above the 200 SMA to indicate that the path of least resistance is to the upside or that support is more likely to hold than to break. The gap between the indicators is widening to reflect stronger bullish momentum. Price is starting to dip below the 200 SMA dynamic support, though, so bearish pressure might be building up.
Stochastic is heading lower to show that sellers have the upper hand, but the oscillator is closing in on the oversold region to signal exhaustion. Turning higher could mean that bullish pressure is returning. RSI also has some room to head south, so natural gas price could follow suit, but the oscillator is approaching oversold levels.
Natural gas is undergoing some downside as the Department of Energy reported a smaller than expected draw in stockpiles of 98 Bcf versus the projected reduction of 149 Bcf and the earlier drop of 338 Bcf. This suggests that demand has been weaker than expected or that supply was elevated.
Keep in mind that traders had been expecting a sizeable draw in inventories since production has been crippled by winter storms in Texas. Then again, a large part of demand has not been fulfilled due to shipping constraints brought about by the weather as well.
The upcoming NFP report could determine whether or not natural gas could sustain a reversal since the actual results would likely impact overall market sentiment and demand for risk.