
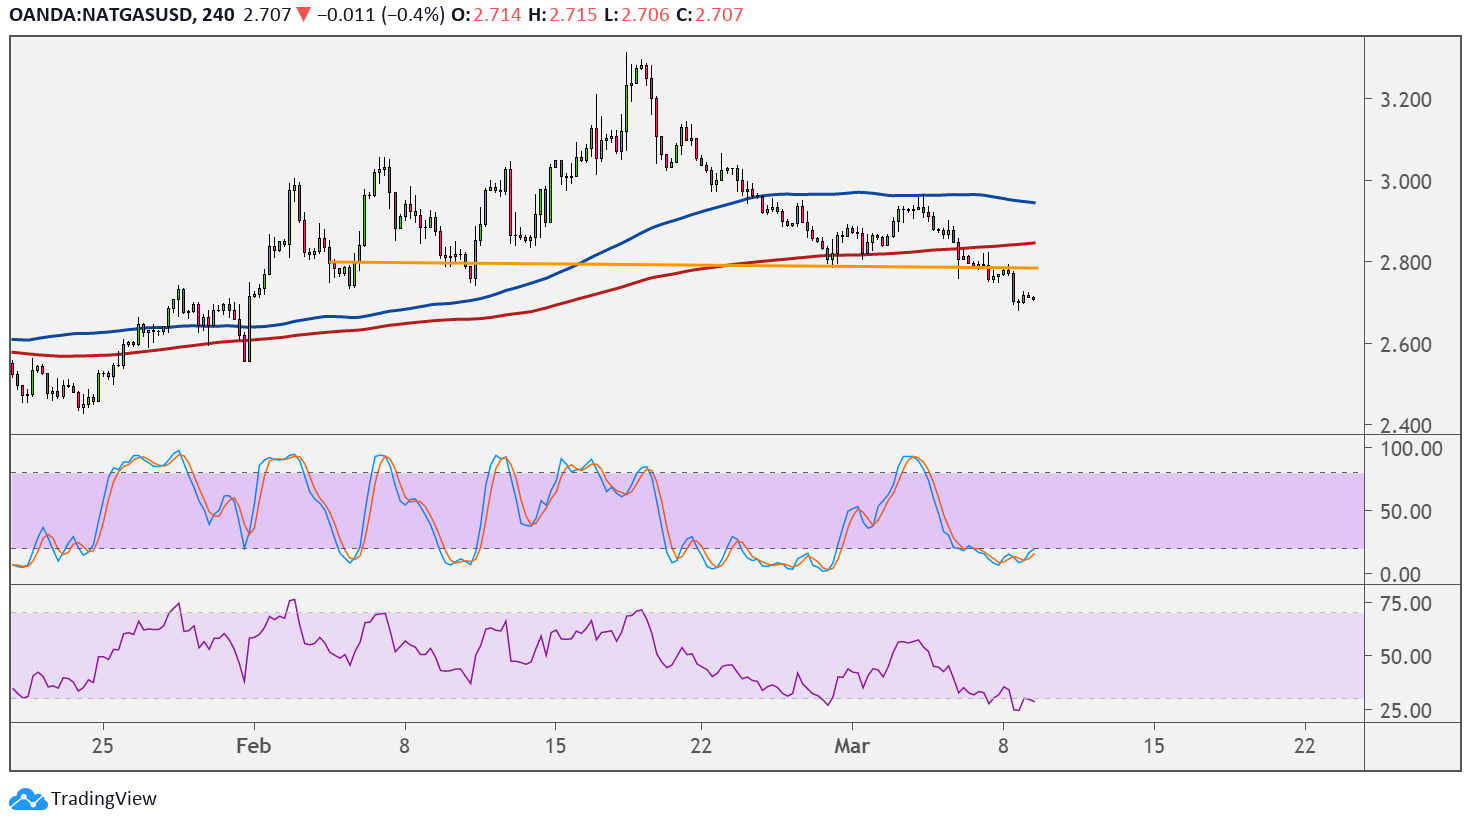
Natural gas broke below the neckline of its head and shoulders pattern to signal that a downtrend is underway. Price could fall by the same height as the chart formation, which spans $2.800 to $3.200.
The 100 SMA is still above the 200 SMA, though, so the path of least resistance is to the upside. In other words, there’s still a chance for the uptrend to resume.

Then again, the gap between the indicators is narrowing to reflect weakening bullish momentum and hint at a potential bearish crossover. If that happens, bearish momentum could pick up.
Stochastic is already indicating oversold conditions, though, so sellers are likely exhausted. Turning higher would mean that buyers are starting to take over. RSI is also hanging around the oversold region to show that bears need a break and that bulls might return from here.
Natural gas saw a smaller than expected draw in stockpiles of 98 Bcf in the latest report of the Department of Energy, suggesting that demand was probably feeble or that supply was elevated. Another small draw in this week’s release could mean more downside for the commodity.
Warmer temperatures have been reported in some states after winter storms much earlier on, and it’s likely that producers ramped up output to make up for the temporary shutdowns in the past weeks.
Risk appetite could still support more natural gas price gains, though, especially with a couple of major central bank decisions lined up this week. No actual changes are expected from the BOC and ECB but hints of keeping policy easy for much longer might keep businesses and consumers optimistic.
The vote on the Biden stimulus package might also impact overall market sentiment since another round of aid could lift spending prospects, which would then be bullish for commodities.