
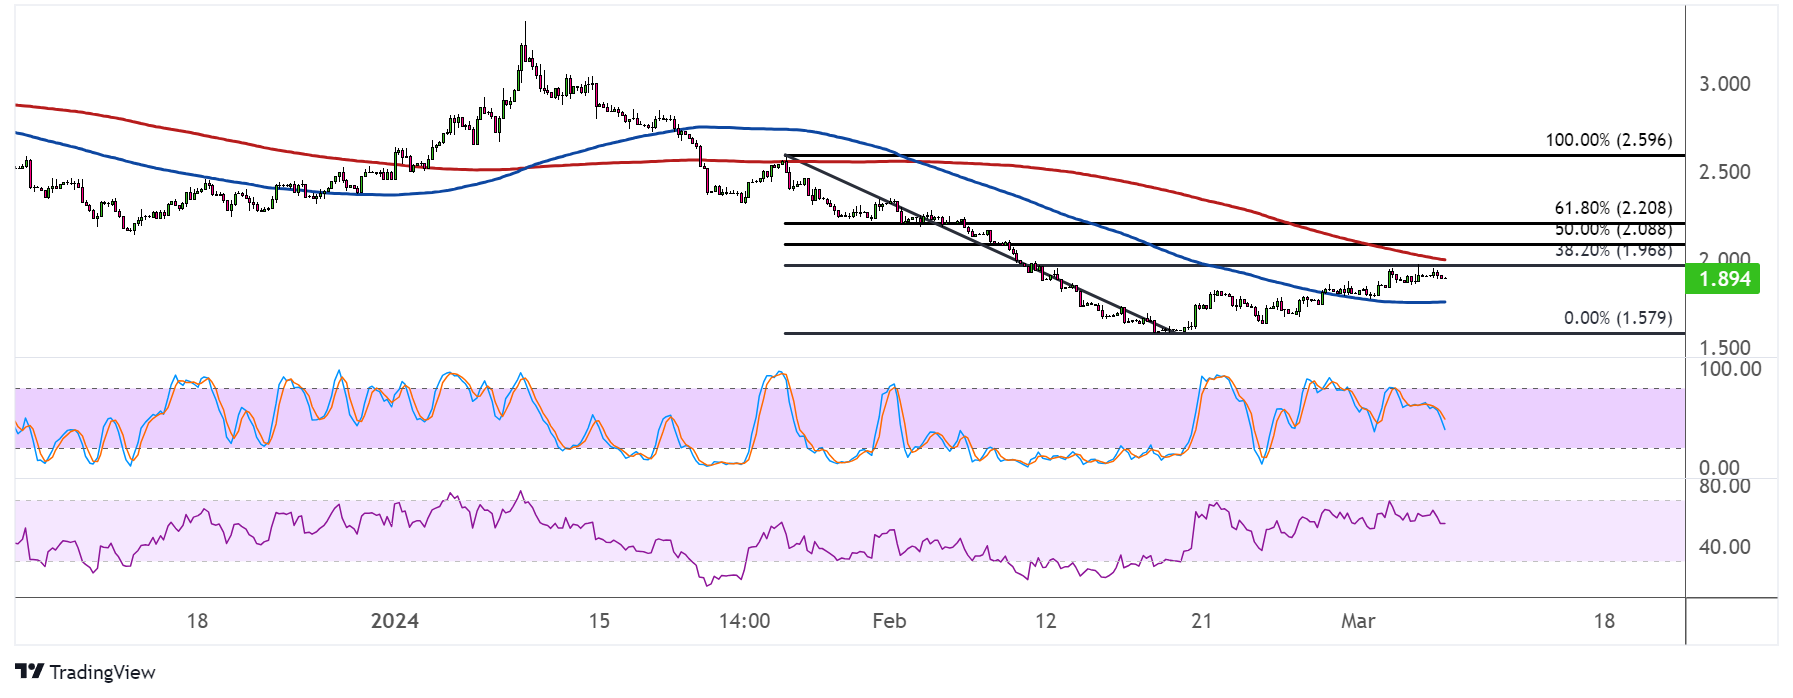
Natural gas is still in correction mode on its long-term charts, as price is closing in on the 38.2% Fibonacci retracement level near $2.000. A larger correction could still test the higher barriers.
The 50% Fib level is at $2.088, then the 61.8% level is at $2.208. If any of these are able to keep gains in check, natural gas could fall back to the lows at $1.579 or lower. After all, technical indicators are reflecting the presence of bearish pressure.

The 100 SMA is below the 200 SMA to indicate that the path of least resistance is to the downside or that the selloff is more likely to gain traction from here. The 200 SMA dynamic inflection point also lines up with the 38.2% Fib to add to its strength as resistance.
Stochastic is heading lower to show that bearish momentum is already in play, and the oscillator has room to move south before reaching oversold levels. The oscillator even formed lower highs while price had higher highs, creating a bearish divergence since late February.
Similarly RSI is on the move down, so natural gas price might follow suit while sellers have the upper hand. The oscillator also has plenty of ground to cover before reflecting exhaustion among sellers.
Natural gas might be in for another wave lower if the inventory report from the Department of Energy does show a smaller reduction of 49 Bcf versus the earlier drop of 96 Bcf in stockpiles. This would confirm that demand has slowed now that winter is coming to a close, dampening demand for heating commodities.
Still, a larger than expected draw might mean some upside for the commodity, as this could also point to constrained supply levels. Risk-taking could also favor commodities and other risk assets if the ECB decision points to stronger odds of a rate cut soon.