
Natural gas could be poised for more losses, as a complex head and shoulders pattern is forming on its longer-term chart. The commodity is currently hovering around the $3.314 level after a significant decline from the peaks observed in early 2025 where prices touched above $4.000.
A break below the neckline support marked on the chart below could confirm that a drop of the same height as the chart formation is in order. Looking at the moving averages, the blue 100 SMA is positioned below the red 200 SMA, confirming that the path of least resistance remains to the downside.

This indicates sellers maintain control of the overall directional bias. Both moving averages could continue to act as dynamic resistance levels on any attempted rallies.
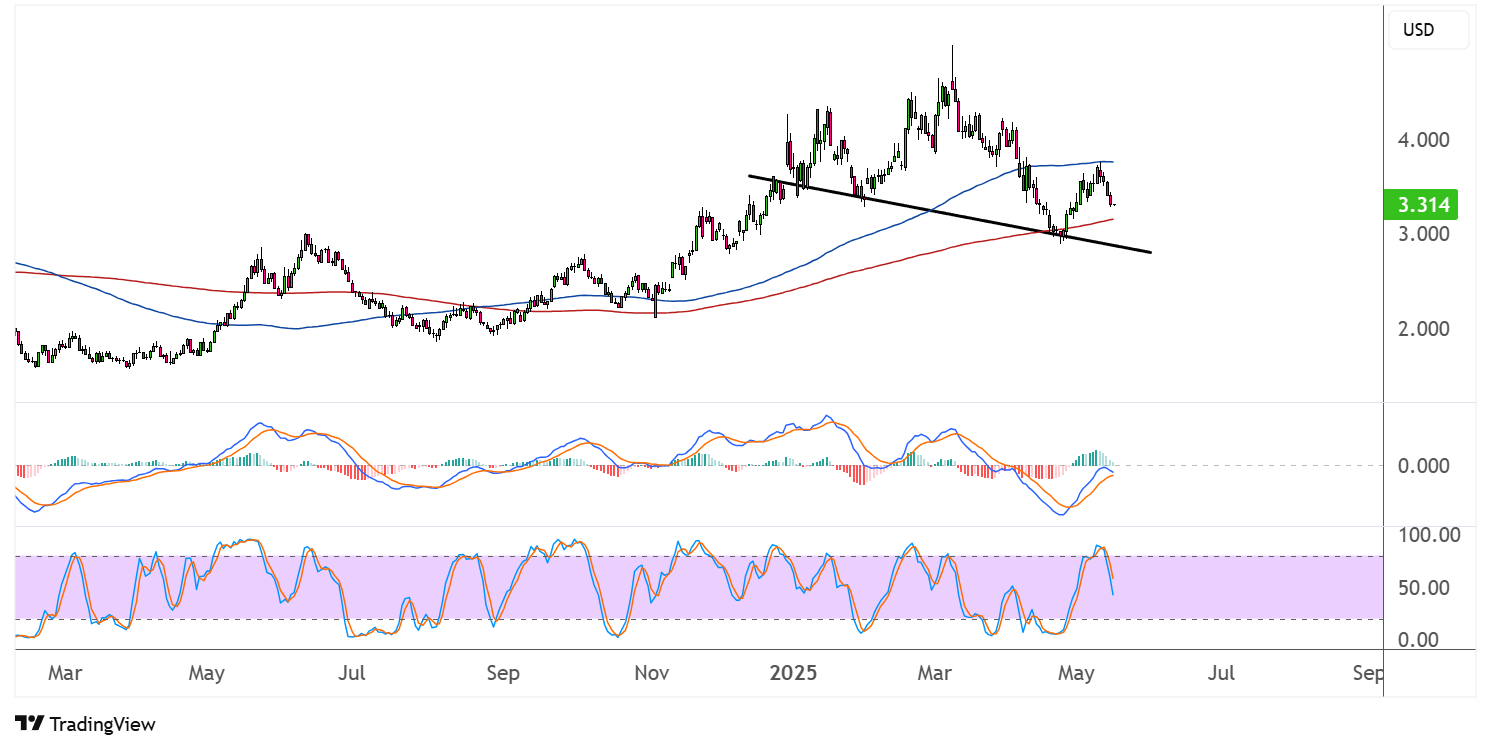
The stochastic oscillator is turning lower from the overbought zone, indicating weakening bullish momentum and suggesting that bearish pressure could pick up in the coming sessions. This oscillator has room to slide before reaching the oversold region, which means the correction could continue until that happens.
Similarly, the RSI appears to be heading south after reaching elevated levels, reinforcing the potential for continued downside in the short term.
Natural gas prices could take further direction from upcoming inventory data, as larger-than-expected builds in stockpiles would point to weakening demand heading into summer. The latest inventory report yielded a 110 Bcf increase in stockpiles, slightly lower than the projected gain of 111 Bcf but still higher than the earlier 104 Bcf increase.
Recent price action also appears influenced by broader market sentiment following Federal Reserve policy signals, with monetary easing expectations potentially providing some support for commodities after US retail sales, CPI and PPI figures fell short of estimates this week.
Overall market sentiment resulting from geopolitical headlines and global trade updates could continue to influence the direction of natural gas and other commodities moving forward.