
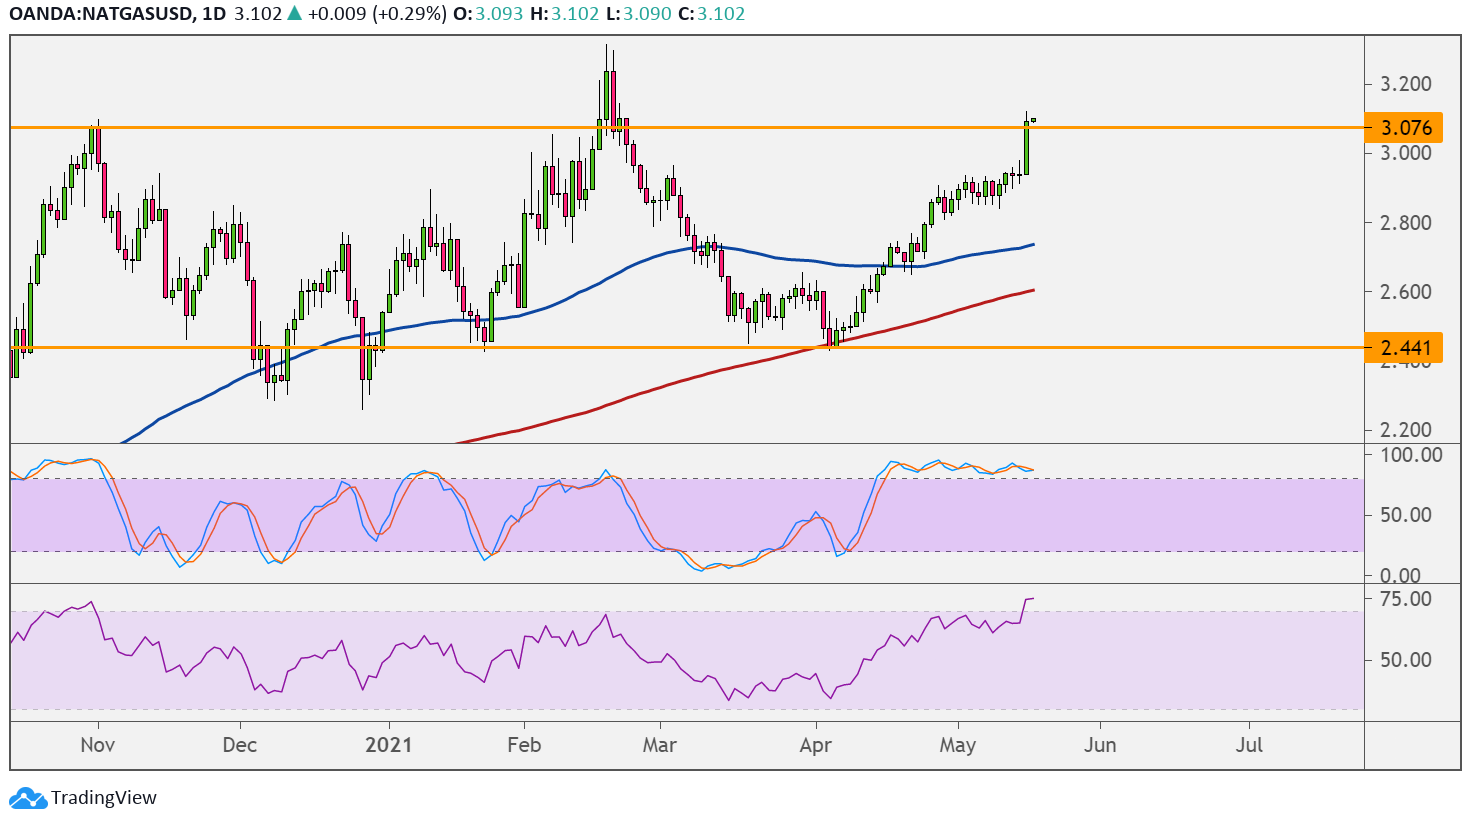
Natural gas is testing the top of its long-term range resistance at $3.075, and technical indicators are giving mixed signals on a bounce or a break.
The 100 SMA is above the 200 SMA to indicate that the path of least resistance is to the upside or that the resistance is more likely to break than to hold. In that case, natural gas could be in for a climb that’s at least the same size as the rectangle pattern.

Also note that a bullish flag pattern appears to have formed, and the break higher confirms that more gains are in the cards. Price is also trading above both moving averages, so these could hold as dynamic support on dips.
However, the gap between the indicators is narrowing to reflect weakening bullish momentum and a potential bearish crossover. If that happens, resistance might hold and sellers could take natural gas down to nearby support levels.
The $2.800 level seems to be a strong area of interest as it lines up with a former resistance and the 100 SMA dynamic inflection point. Sustained selling pressure could take natural gas down to the range bottom at $2.450.
Stochastic has been indicating overbought conditions for quite some time, which means that buyers could use a break and let sellers take over. Turning lower would confirm that bearish pressure is kicking in and that bears would defend the range resistance.
RSI has also just reached the overbought zone to reflect exhaustion among buyers, and natural gas could follow suit once the oscillator moves south.
Natural gas prices surged in the past trading sessions thanks to forecasts of warmer temperatures for the eastern half of US later this month.
“The changes were focused mostly in the Midwest to East,” Bespoke Weather Services said. “…This breaks the trend we had taken note of recently where models had been too warm in the medium range only to progress forward cooler. “