
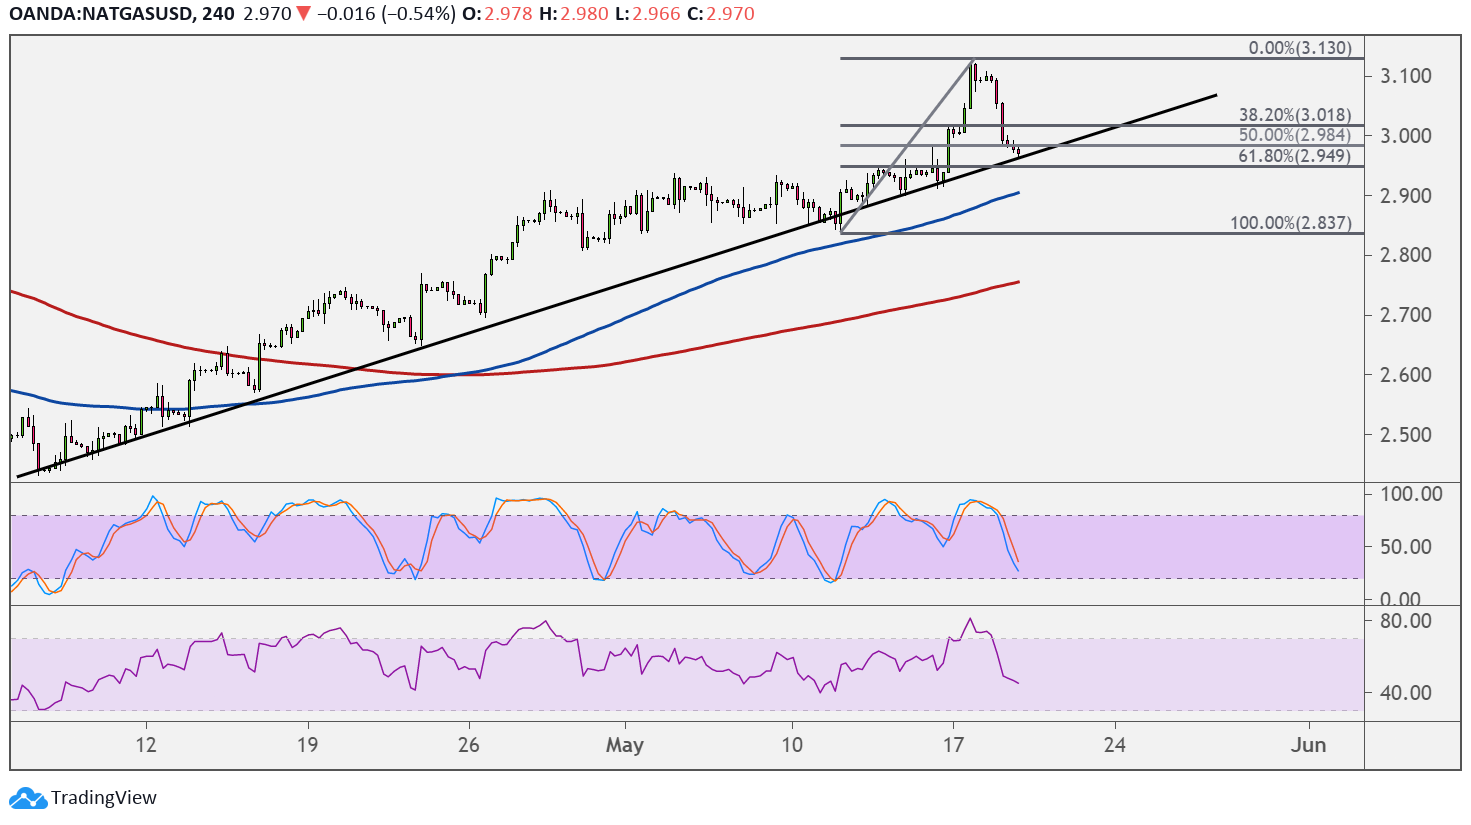
Natural gas is trending higher on its 4-hour chart as price is finding support at a rising trend line that’s been holding since mid-April. This lines up with several inflection points that add to its strength as a floor.
The 50% level appears to be holding as it lines up with the $3.000 major psychological mark and the trend line itself. A larger dip could last until the 61.8% level at $2.950 or the 100 SMA dynamic inflection point.

On the subject of moving averages, the 100 SMA is above the 200 SMA to confirm that the path of least resistance is to the upside. In other words, support is more likely to hold than to break. The gap between the indicators is widening to reflect strengthening bullish momentum.
A larger dip could reach the 100 SMA dynamic inflection point at $2.900 but this would be below the trend line support. Stochastic is still on its way down to show that bearish pressure is present until the oscillator reaches the oversold area.
RSI has more room to head lower, so there could be a chance for a breakdown and reversal from the climb. If any of the support zones hold, though, natural gas could recover to the swing high at $3.130 or higher.
Natural gas is taking hits ahead of the release of the inventory report from the Department of Energy, as traders fear that a build in stockpiles might be reported. Warming temperatures likely sapped demand for the heating commodity, although purchases might pick up as summer months would support cooling commodities next.
A build of 60 Bcf is eyed for the previous week, lower than the earlier 71 Bcf increase. A smaller than expected increase would signal that demand is supported or that oversupply is not a major concern at the moment.