
Natural gas has been riding an ascending trend line since the start of May, with the commodity posting a series of higher lows that reflect sustained buying interest.
Price recently peaked near the swing high at $3.055 before pulling back, and is now testing the Fibonacci retracement levels that mark potential areas of support. The 38.2% Fib sits at $2.935, which has already been tested as price retreated from the highs.

A deeper correction could bring natural gas down to the 50% level at $2.898, which also aligns closely with the ascending trend line and the 100 SMA dynamic inflection point, making it a particularly compelling area of interest for buyers.
A larger pullback could reach the 61.8% Fib at $2.861, near where the 200 SMA could offer additional confluence as dynamic support.
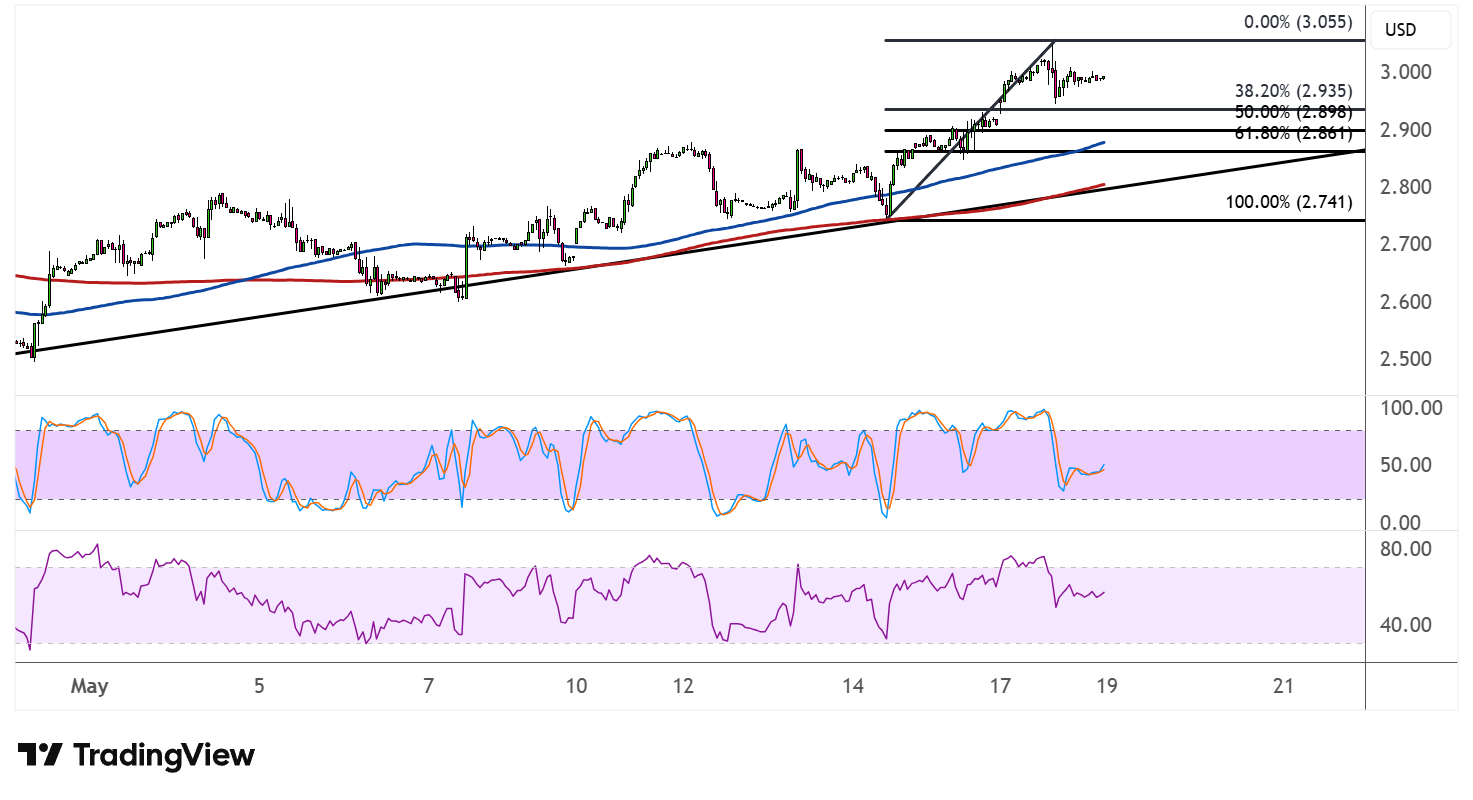
On the subject of moving averages, the 100 SMA is now above the 200 SMA, confirming that the path of least resistance is to the upside and that the broader climb is more likely to gain traction than to reverse. Both moving averages are trending higher, reinforcing the bullish structure as long as the trend line holds.
Stochastic is pulling back from the overbought region and has room to slide further before reaching oversold territory, suggesting that the correction could still have some legs. A turn higher from current levels, however, would signal a return in bullish pressure.
RSI is also easing off from elevated levels but remains above the midpoint, so buyers haven’t fully ceded control just yet. If either indicator rebounds from here, natural gas could be poised to resume its push toward the $3.055 swing high or potentially establish fresh highs above that mark.
Natural gas appears to be drawing support from crude oil price rallies tied to escalating geopolitical tensions in the Middle East while the U.S. mulls military action against Iran and the Strait of Hormuz closure extends.