
Natural gas has broken below the bottom of its ascending channel on the short-term time frame, signaling that a reversal from the earlier uptrend could be underway.
Price is currently hovering around the $2.848 area, just below the channel floor and the swing low level at $2.841, suggesting that bearish momentum is gaining traction.

However, a corrective bounce could still take place before sellers fully regain control. The Fibonacci retracement tool drawn from the recent swing high shows where sellers could be waiting to re-enter the downtrend.
The 38.2% Fib is at $2.937, while the 50% level is at $2.967. A larger pullback could reach the 61.8% Fib at $2.996, which lines up closely with the broken channel bottom and the 100 SMA dynamic inflection point, a confluence zone that could attract renewed selling interest.
A clean rejection at any of the Fib levels, particularly the 50% or 61.8%, could be a signal that the downtrend is resuming toward the swing low at $2.841 or potentially lower.
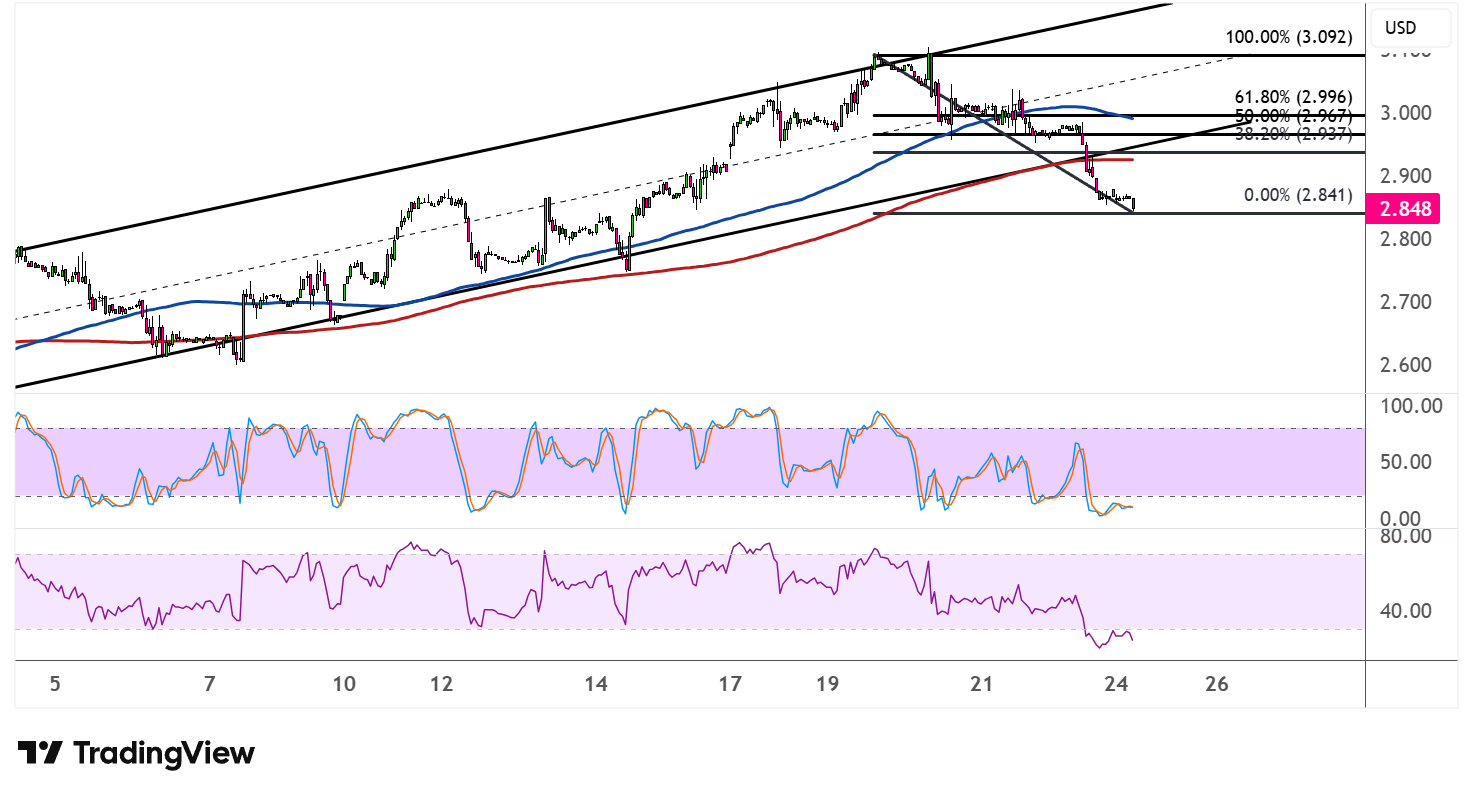
The 100 SMA has crossed below the 200 SMA, confirming that the path of least resistance is now to the downside and that the broader selloff could extend further if the Fibs fail to cap any relief rallies.
Stochastic is pulling back up from near the oversold area, suggesting that a short-term corrective bounce is possible. The oscillator has room to recover before reaching the overbought zone, which could give price enough energy to test the Fibonacci retracement levels before sellers step back in.
RSI, on the other hand, is still pointing lower with plenty of room to slide before reaching oversold territory, so the broader bearish pressure could keep weighing on price even if a temporary bounce materializes.
Natural gas appears to be taking cues from crude oil markets which are sliding on account of easing geopolitical tensions and the prospect of the Strait of Hormuz reopening.