
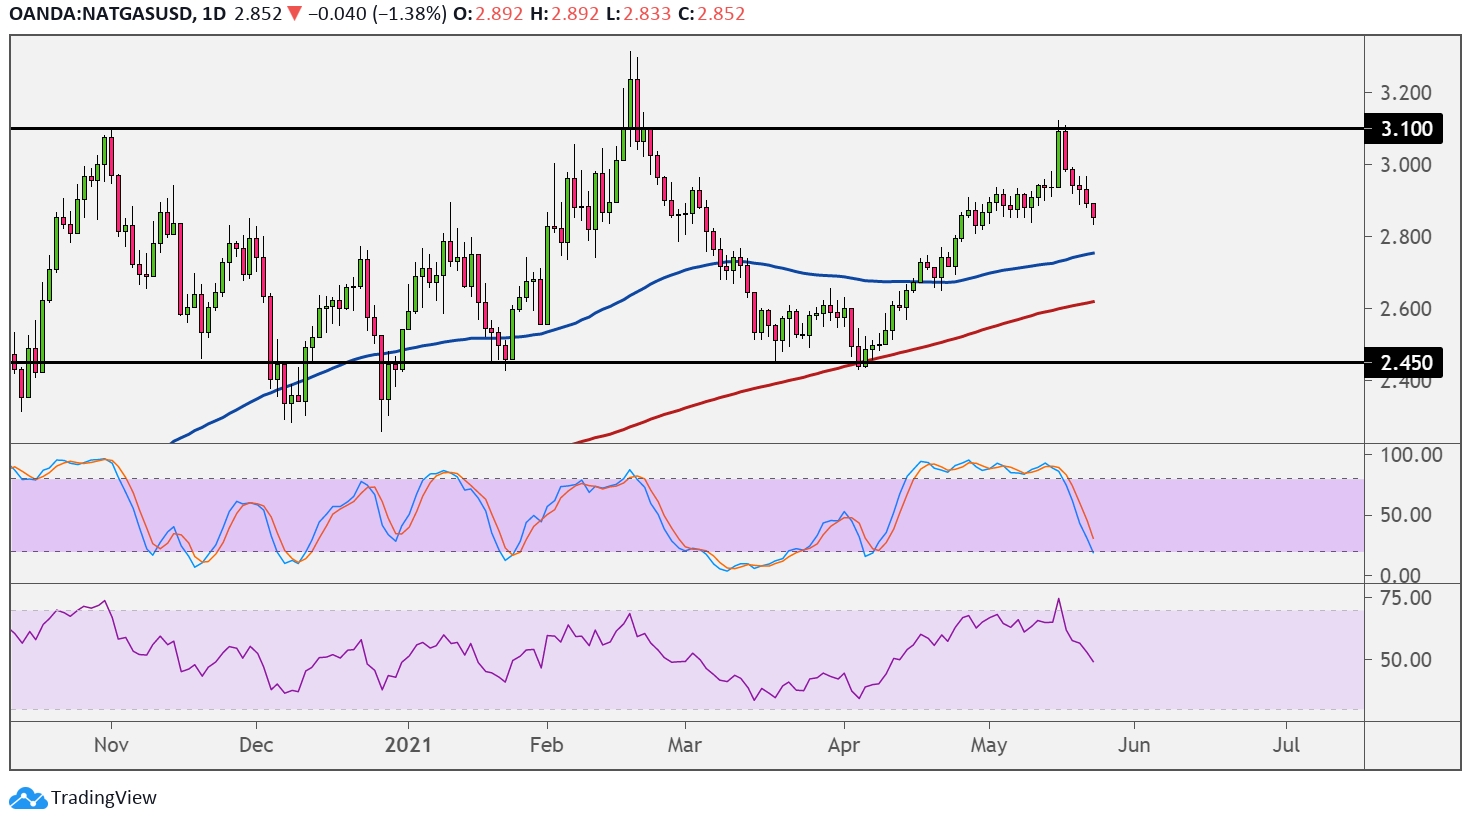
Natural gas hit a ceiling at the top of its range visible on the daily time frame. Price could be setting its sights on the bottom of the range around $2.450 from here.
Stochastic is already on the move down to confirm that selling pressure is present, so natural gas price could keep following suit. This oscillator is nearing the oversold area to signal seller exhaustion, though. Turning higher would mean that buyers are taking over.

RSI is also heading lower to show that sellers have the upper hand, and this oscillator has more room to head lower before reaching the oversold region.
The 100 SMA is above the 200 SMA to indicate that the path of least resistance is to the upside or that support is more likely to hold than to break. Price is also above both moving averages, so these could hold as dynamic support on dips.
Then again, the gap between the indicators is narrowing to reflect weakening bullish momentum and a potential bearish crossover. If that happens, selling pressure could pick up.
Natural gas could once again take cues from inventory data from the Department of Energy, as a large build in stockpiles would reflect weaker demand. Recall that temperatures have been rising in several parts of the US, as summer months are rolling in.
While this means weaker purchases of heating commodities, it could also bring in a pickup in demand for cooling commodities like natural gas. This seasonal demand could kick in much later on, though.
Also, any major swings in market sentiment would likely impact natural gas and other commodities throughout the week. Recall that the Fed’s inclination to taper asset purchases soon might mean higher borrowing costs down the line, which could dampen business activity and investor optimism.