
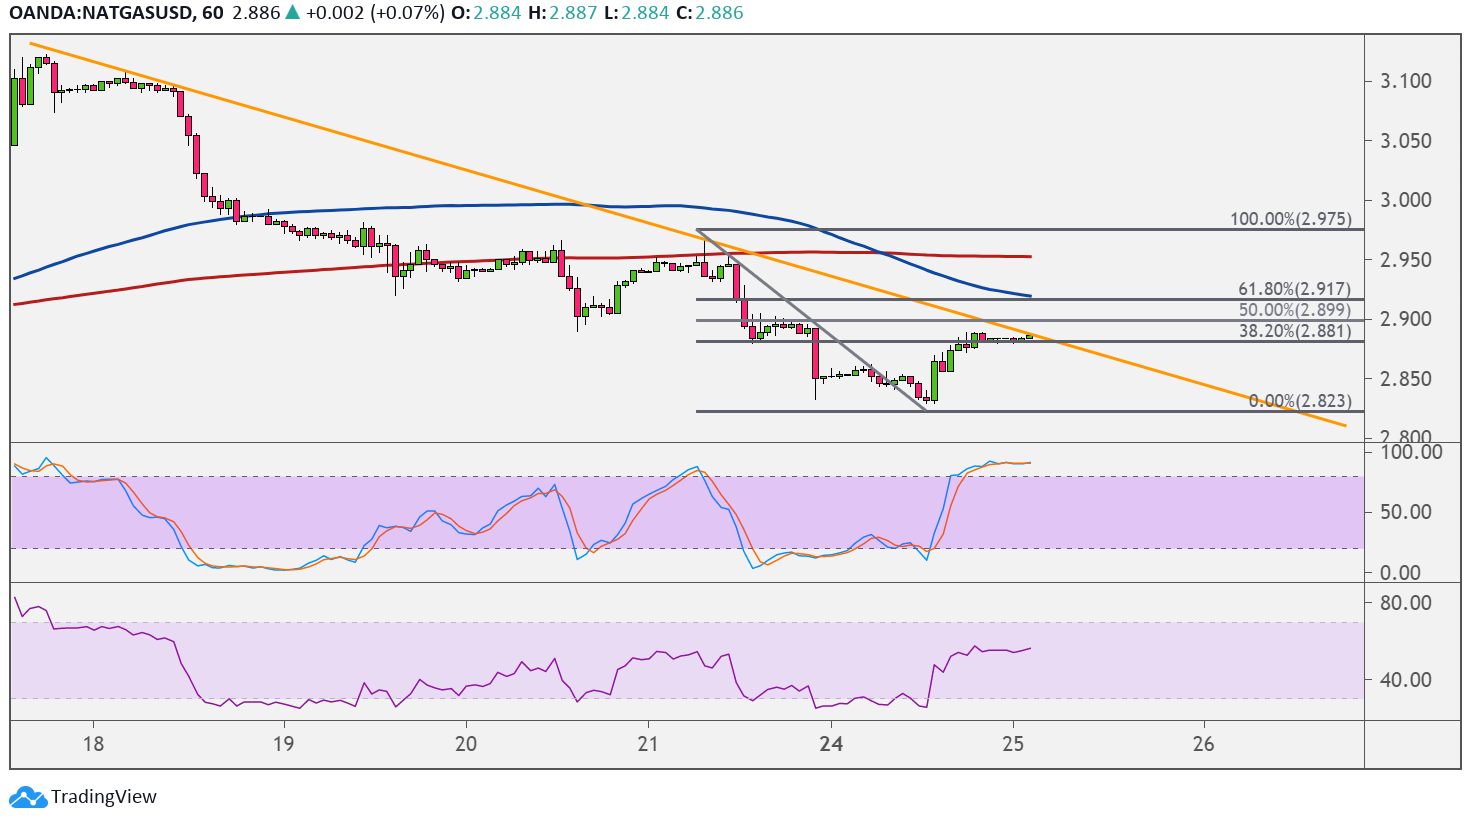
Natural gas is trending lower on its 1-hour time frame, with the highs connected by a falling trend line since last week. Price is testing this resistance area where more sellers might be looking to jump in.
This happens to line up with the 38.2% Fibonacci retracement level around $2.881, which seems to be keeping gains in check for now. A larger pullback could reach the 50% Fib at $2.899 or the 61.8% level at $2.917, which is near the 100 SMA dynamic inflection point.

On the subject of moving averages, the 100 SMA is below the 200 SMA to confirm that the path of least resistance is to the downside or that the selloff is more likely to resume than to reverse.
Stochastic has been indicating overbought conditions for a while, which means that sellers are exhausted and that buyers could take over. If that happens, natural gas could slide back to the lows at $2.823 or lower.
RSI is on the move up to suggest that there is a bit of bullish pressure left before reaching the overbought zone, so a higher pullback could be possible. A break past the moving averages and swing high at $2.975, on the other hand, could mean that a reversal from the selloff is due.
Natural gas could take cues from the inventory report from the Department of Energy, which indicated a larger than expected build of 71 Bcf last time. A smaller increase in stockpiles for the latest reporting period could reflect a pickup in demand, which could be bullish for the commodity.
On the other hand, a large increase could suggest that businesses are being cautious about their purchases of heating or cooling commodities or that supply remains elevated. Still, forecasts of warmer temperatures up ahead could limit potential losses since this would mean that demand is likely to tick higher in the near-term.