
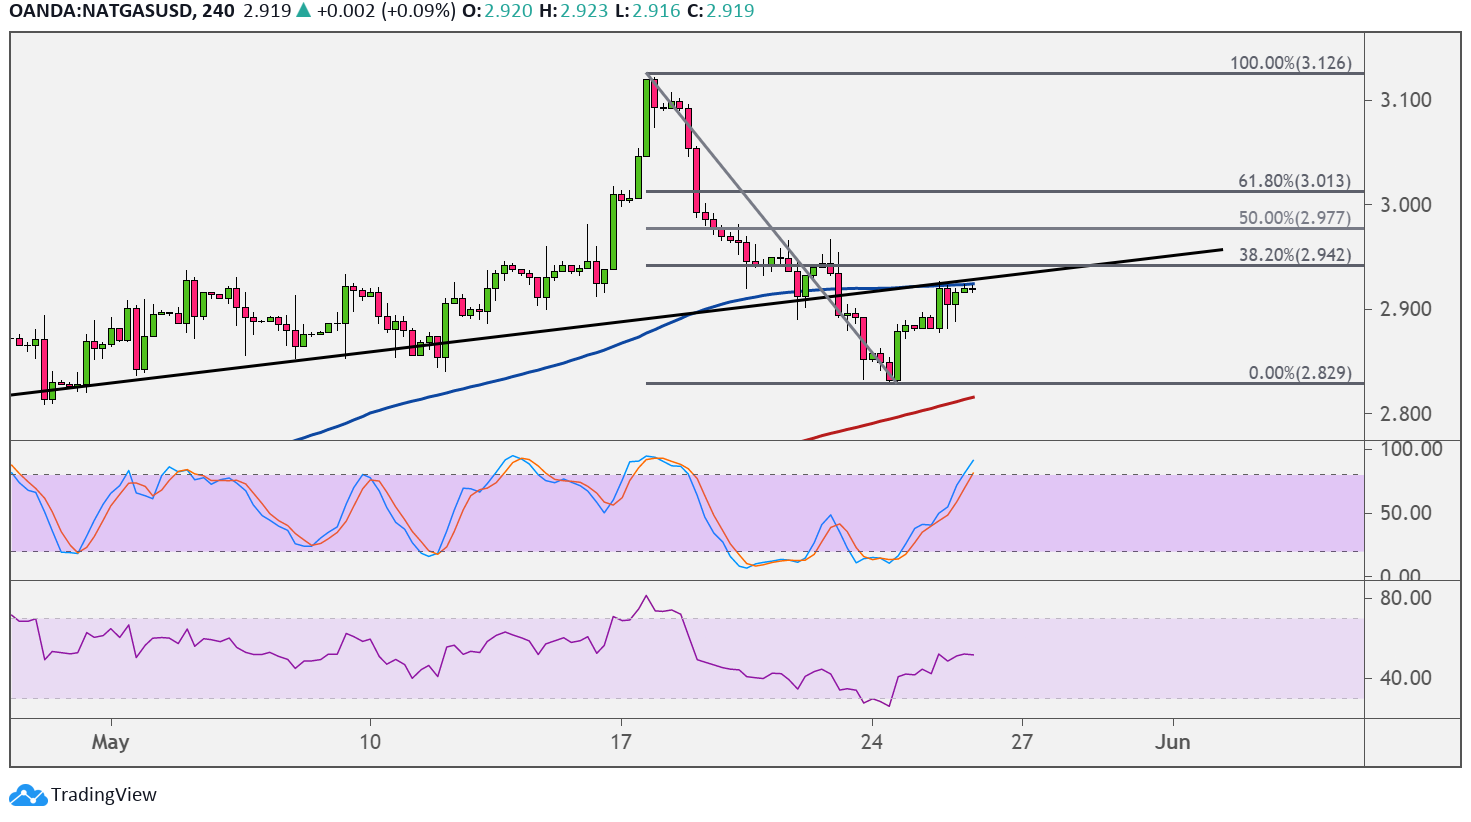
Natural gas recently fell through a rising trend line support visible on the 4-hour time frame to signal that a reversal from the climb is underway. Price is still retesting the broken trend line that might hold as resistance.
This lines up with the 38.2% Fibonacci retracement level at the $2.942 mark and the 100 SMA dynamic inflection point. This moving average is still above the 200 SMA to suggest that the path of least resistance is to the upside or that resistance might still break.

A larger pullback could reach the 50% level at $2.977 or the 61.8% Fib at $3.013. Stochastic is still heading higher to show that buyers have the upper hand, but the indicator is nearing the overbought zone to signal exhaustion among bulls. Turning lower could confirm that sellers are taking over, possibly taking natural gas down to the lows at $2.829.
RSI has more room to climb before reaching the overbought zone, so buyers could stay in control for a bit longer and spur a larger correction.
Natural gas traders would likely take cues from the upcoming inventory report from the Department of Energy. A large build in stockpiles would suggest that demand has weakened on account of warmer temperatures in several US cities.
Then again, the summer months could bring in more purchases of cooling commodities, which would also be bullish for natural gas. A draw in inventories would confirm this and likely mean more gains for the commodity.
Major swings in market sentiment could also impact natural gas price action in this latter half of the week, especially with the US core PCE price index due. This is the Fed’s preferred inflation measure, so it would be highly-watched and likely indicative of what the central bank’s monetary policy bias might be.