
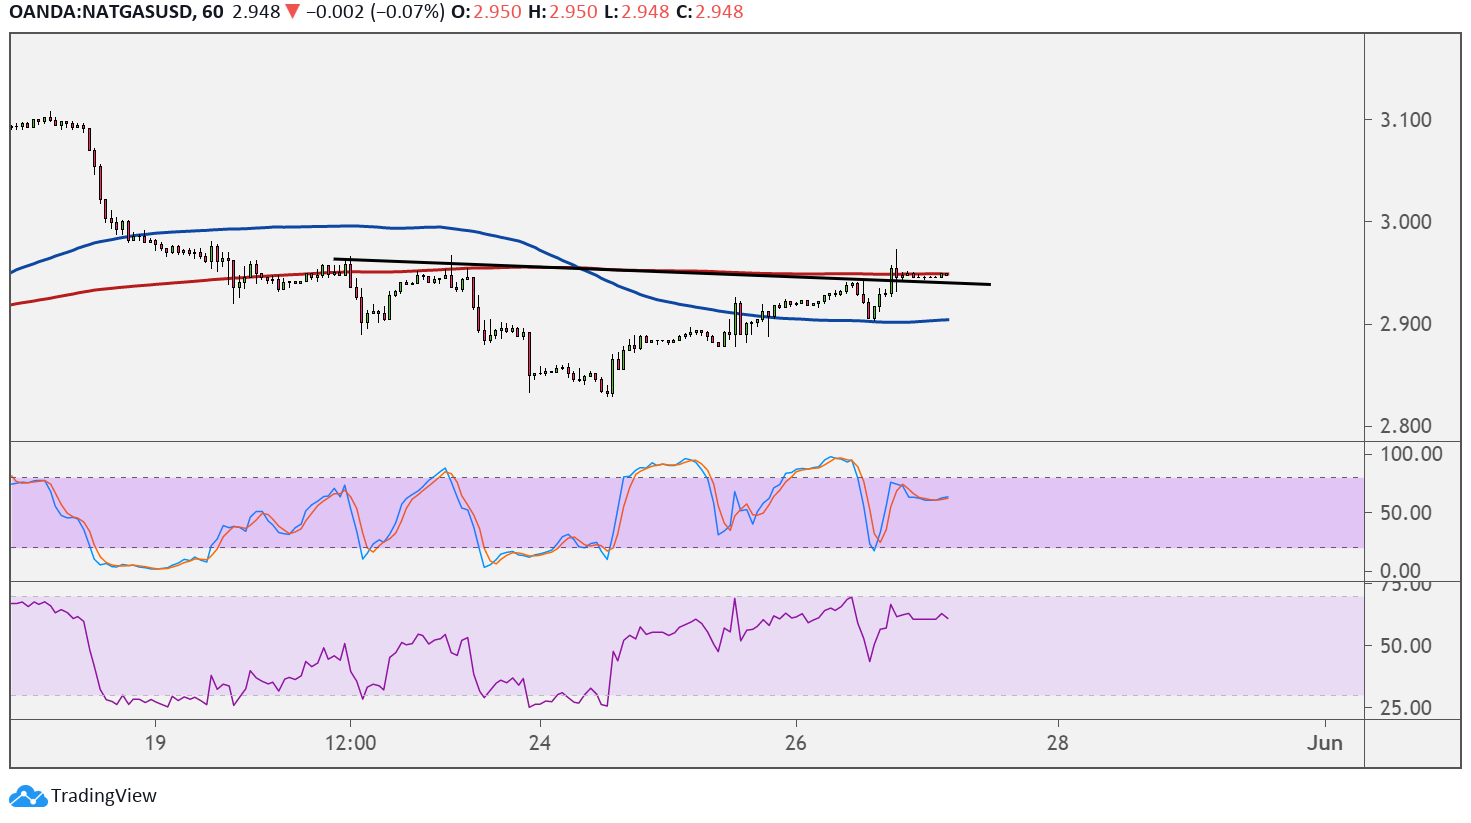
Natural gas could be due for a reversal as price is forming an inverted head and shoulders pattern on its 1-hour chart. The neckline seems to be breaking, possibly sending the commodity up by the same height as the chart formation.
The reversal pattern spans around $0.100 in height so the resulting climb could be of at least the same size, taking natural gas up to $3.050 or higher.

However, the 100 SMA is below the 200 SMA to indicate that the path of least resistance is to the downside or that resistance is more likely to hold than to break. The 200 SMA dynamic inflection point also lines up with the neckline to add to its strength as resistance.
Stochastic seems to be turning lower to signal that a return in selling pressure is due. RSI is also pointing down to suggest that sellers are about to take over, and both oscillators have plenty of room to head down before reflecting oversold conditions.
Natural gas could be in for a dip if the inventory report from the Department of Energy shows a build of 105 Bcf as expected. This would be larger than the earlier increase of 71 Bcf, reflecting slower demand in the latest reporting week.
A smaller than expected build or a surprise draw would suggest that purchases are still supported or that oversupply is not a major concern at the moment. Keep in mind that temperatures have increased in the past weeks, likely weighing on purchases of heating commodities.
Then again, the summer months could bring in stronger demand for cooling commodities, which also includes natural gas. Risk appetite would likely impact commodity price action for the rest of the week, especially with the US core PCE price index lined up and likely indicative of Fed policy bias.