
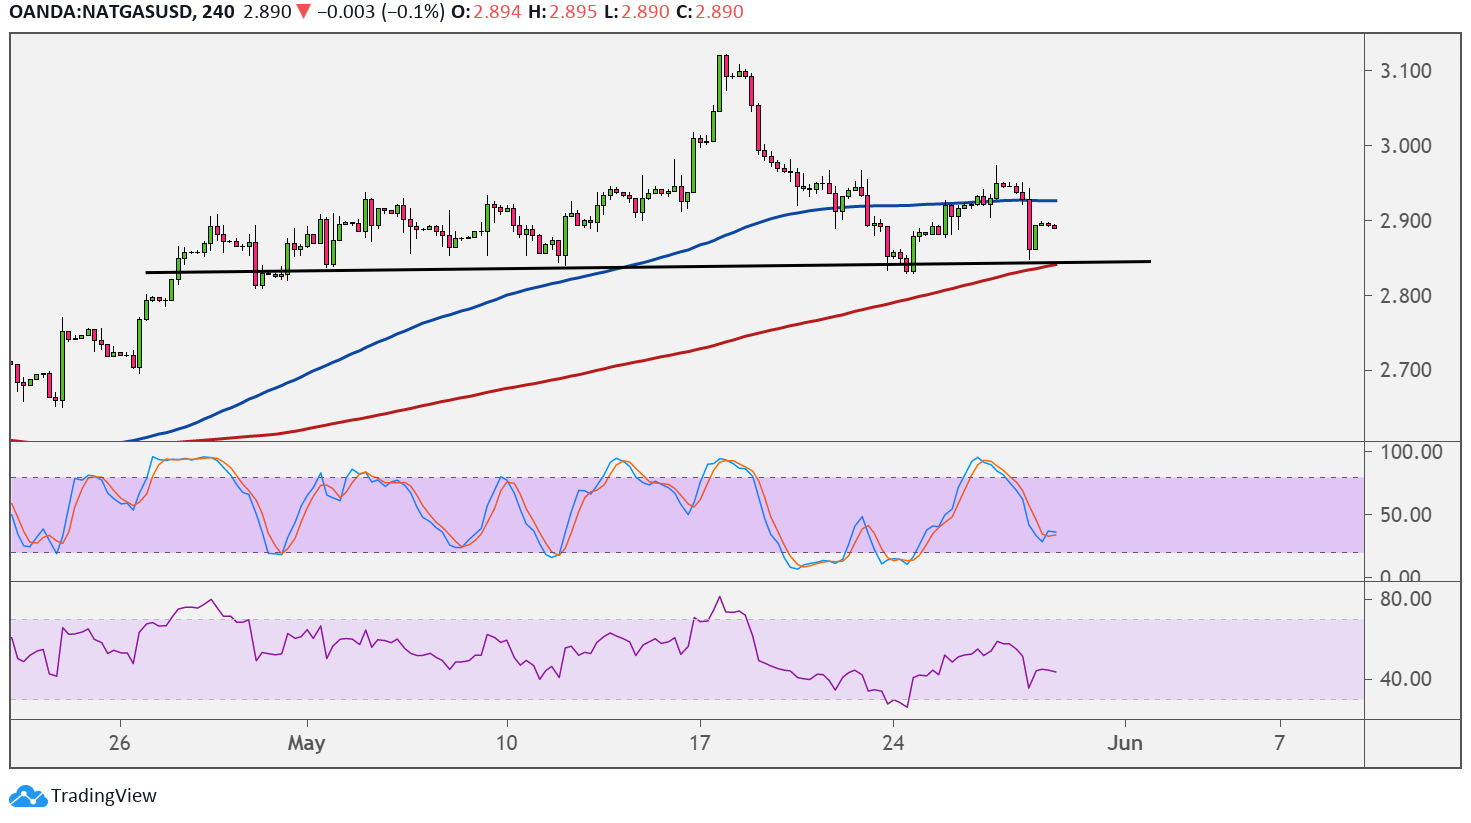
Natural gas could be in for a reversal from its uptrend as price is forming a head and shoulders pattern on its 4-hour chart. Price has yet to break below the neckline to confirm that a selloff would follow.
A move below the neckline around $2.850 could set off a slide that’s at least the same height as the reversal pattern, which spans around $0.300. The neckline coincides with the 200 SMA dynamic inflection point, which adds to its strength as a floor.

On the subject of moving averages, the 100 SMA is above the 200 SMA to confirm that the path of least resistance is to the upside or that the climb is more likely to resume than to reverse. However, the gap between the moving averages is narrowing to reflect weakening bullish pressure.
Stochastic is heading lower to show that sellers have the upper hand, and the oscillator has a bit of room to go before reaching the oversold region to signal exhaustion. RSI is on middle ground to indicate consolidation, though.
Natural gas prices took a hit as the Department of Energy reported a larger than expected build in stockpiles of 115 Bcf versus the projected increase of 105 Bcf and the earlier gain of 71 Bcf.
This suggests that demand took a hit as purchases of heating commodities slowed on account of warmer temperatures. Then again, purchases could pick up again sooner or later once the summer months roll in and drive up the need for cooling commodities, which also includes natural gas.
The upcoming US core PCE price index release might bring some volatility for markets in general, as a strong inflation read could prompt speculations of higher borrowing costs down the line. In turn, this could weigh on higher-yielding assets like commodities since tighter monetary policy could dampen business activity.