
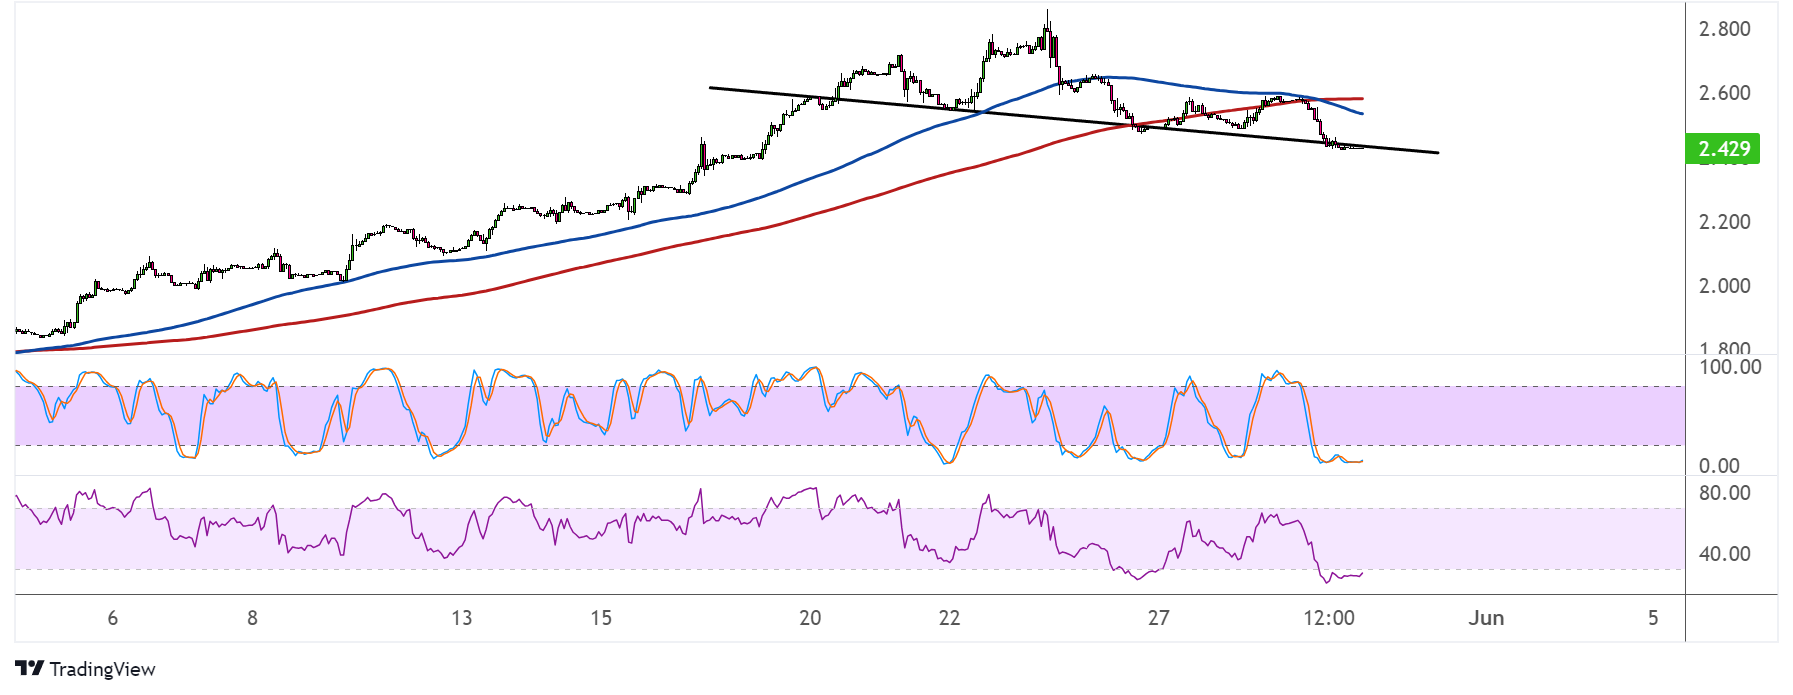
Natural gas might be in for a selloff, as the commodity is forming a head and shoulders pattern on its hourly time frame. Price is testing the neckline support around $2.430, and a break lower could confirm that a downtrend is in the works.
The 100 SMA is also crossing below the 200 SMA to confirm that the trend is turning lower, and the commodity price is trading below both moving averages so these could keep holding as dynamic resistance.

With that, natural gas could fall by the same height as the formation or around $0.400 down to the $2.000 major psychological mark.
However, stochastic is indicating oversold conditions or exhaustion among sellers, so turning higher would mean a return in upside pressure. RSI has also been indicating oversold conditions for quite some time and has plenty of room to climb before reflecting exhaustion among buyers, so price might keep following suit on its climb.
Natural gas could still take cues from inventory data, as stronger consumption of cooling commodities might be in play now that temperatures are rising due to the summer season.
Analysts are expecting a slightly smaller build of 77 Bcf versus the earlier gain of 78 Bcf, likely leading to some support for the commodity. A much lower increase could bring fresh upside for natural gas on higher demand conditions while a larger gain could translate to losses.
The US dollar is set to take cues from the preliminary GDP release, as downward revisions are eyed and might be enough to dampen hawkish Fed expectations. Stronger than expected data, however, might still be enough to prop up the safe-haven currency versus commodities.
Later in the week, the US core PCE price index might also impact USD behavior and overall market sentiment, as this is the central bank’s preferred inflation measure.