
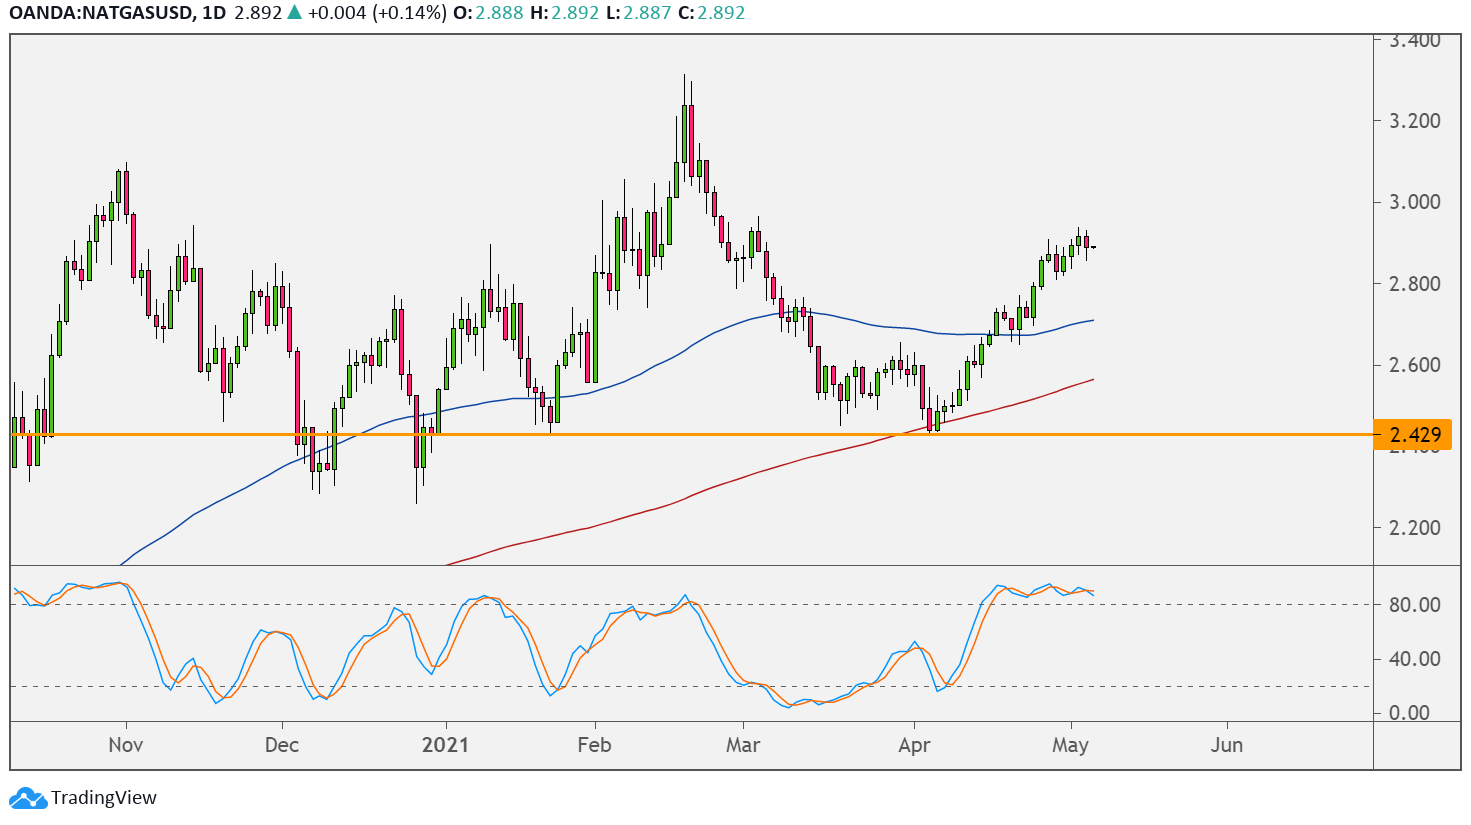
Natural gas has been on a tear, but it looks like the rally could top out close to the $3.000 major psychological mark. A bearish divergence can be seen on the daily time frame.
In particular, price formed lower highs while stochastic had higher highs, signaling that the rally could soon reverse. The oscillator has yet to turn lower from the overbought zone to confirm a return in selling pressure, though.

If that happens, natural gas could slide back to nearby support zones. The 100 SMA is around an area of interest or former resistance that might hold as support around $2.800. Stronger selling pressure could take the commodity down to the 200 SMA dynamic support at $2.600 or the long-term floor at $2.430.
The 100 SMA is still above the 200 SMA to indicate that the path of least resistance is to the upside or that support levels are more likely to hold than to break. Price is also moving above both indicators as additional confirmation of bullish pressure. Then again, the gap between the indicators is narrowing to reflect slowing bullish momentum and a potential bearish crossover.
Natural gas traders would likely take cues from the Department of Energy’s inventory report, which is slated to show a larger 68 Bcf build compared to the earlier increase of 15 Bcf. An even larger increase might mean a steeper selloff for the commodity.
On the other hand, a small build or a surprise draw could signal that demand is picking up, especially as the warmer weather lifts purchases of cooling commodities. Also, risk appetite has been in play now that business and consumer activity are picking up due to the gradual reopening of some economies.
A return in risk aversion, on the other hand, could mean some downside for the higher-yielding asset. Downside surprises in US jobs data could bring demand for safe-havens back up.