
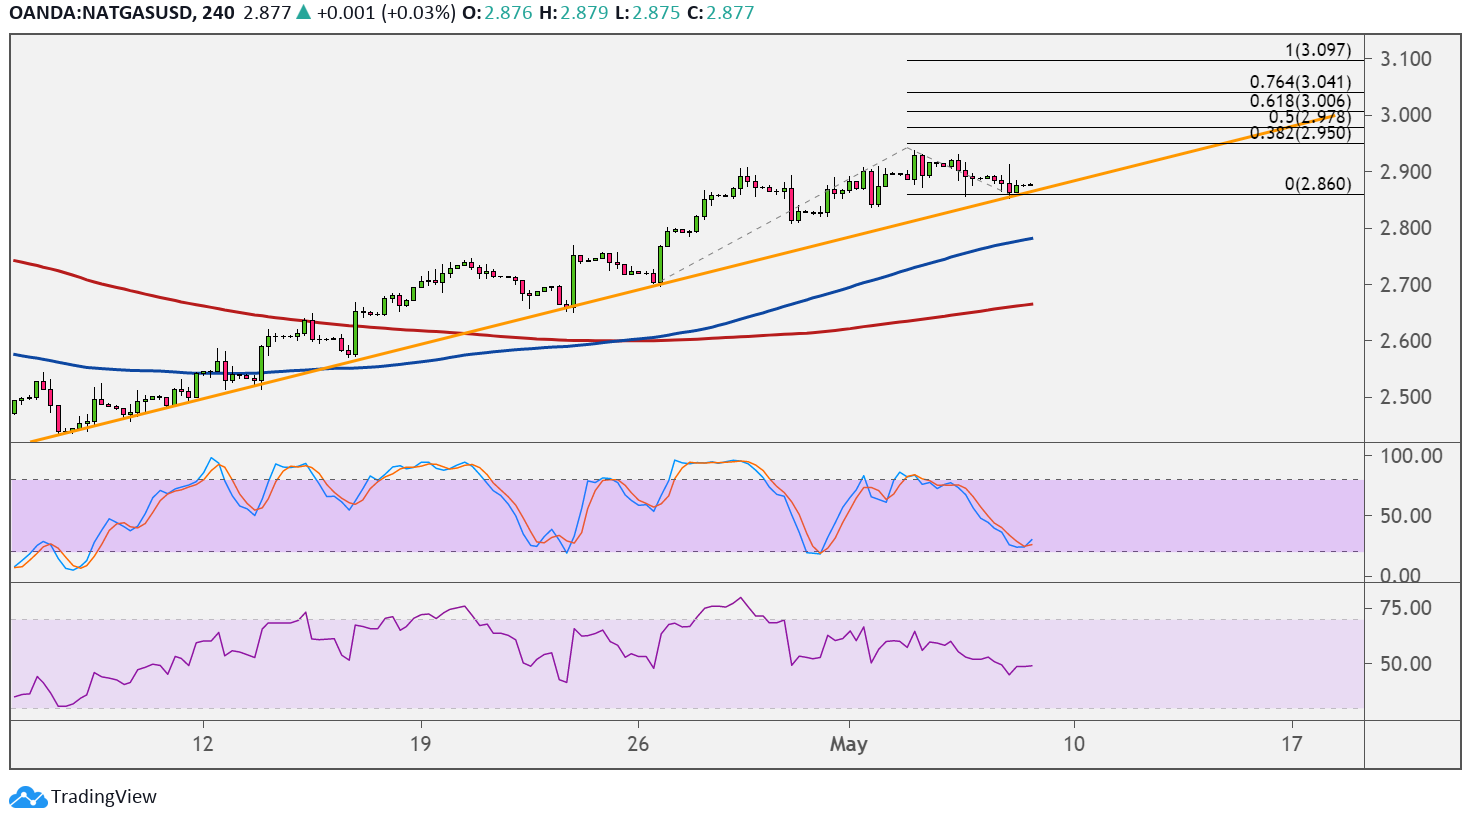
Natural gas is testing the rising trend line support on its 4-hour chart. Holding as a floor could allow the commodity to resume its climb to the upside targets marked by the Fibonacci extension tool.
The 38.2% level lines up with the swing high around $2.950 then the 50% to 61.8% levels are near the $3.000 major psychological mark. Stronger bullish pressure could take natural gas up to the 76.4% extension at $3.041 or the full extension near the $3.100 handle.

The 100 SMA is above the 200 SMA to confirm that the path of least resistance is to the upside or that the rally is more likely to resume than to reverse. The gap between the indicators is widening to reflect strengthening bullish momentum.
Stochastic has yet to indicate oversold conditions or exhaustion among sellers, but the oscillator already seems to be bottoming out. Turning higher from here would suggest that buyers are eager to take over and allow the uptrend to resume.
RSI, on the other hand, is heading south to show that there is some selling pressure left. A break below the trend line around $2.860 could set off a reversal from the climb, although the moving averages might still hold as dynamic support levels.
The EIA reported a weekly gain of 60 Bcf in natural gas storage, lower than the expected increase of 68 Bcf but larger than the previous build of 15 Bcf.
Total stocks now stand at 1.958 trillion cubic feet, down 345 billion cubic feet from a year ago and 61 billion cubic feet below the five-year average, the government said.
This signals that demand has weakened now that temperatures are rising across the US but that purchases might have been stronger than expected or that supply is limited.
Looking ahead, the NFP release might impact overall market sentiment and push commodities around as volatility would likely pick up.